|
Download Data (XLS File) |
|
||||||||
|
||||||||
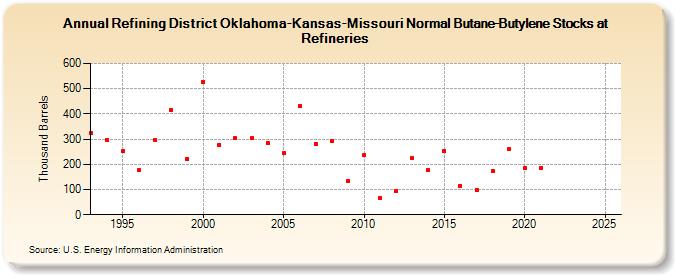
| Refining District Oklahoma-Kansas-Missouri Normal Butane-Butylene Stocks at Refineries (Thousand Barrels) | ||||||||
| Decade | Year-0 | Year-1 | Year-2 | Year-3 | Year-4 | Year-5 | Year-6 | Year-7 | Year-8 | Year-9 |
|---|---|---|---|---|---|---|---|---|---|---|
| 1990's | 323 | 298 | 251 | 176 | 296 | 414 | 221 | |||
| 2000's | 528 | 277 | 304 | 303 | 285 | 245 | 433 | 282 | 292 | 134 |
| 2010's | 235 | 65 | 94 | 224 | 178 | 251 | 114 | 100 | 174 | 259 |
| 2020's | 184 | 186 | -- | -- |
| - = No Data Reported; -- = Not Applicable; NA = Not Available; W = Withheld to avoid disclosure of individual company data. |
| Release Date: 8/30/2024 |
| Next Release Date: 8/29/2025 |