|
Download Data (XLS File) |
|
||||||||
|
||||||||
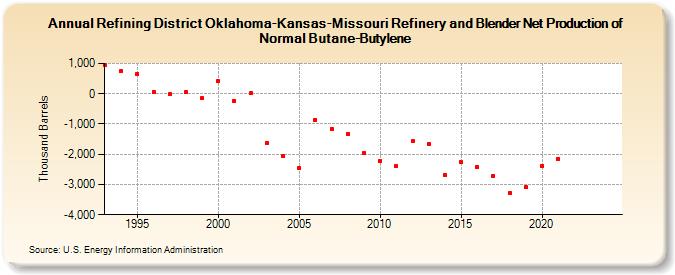
| Refining District Oklahoma-Kansas-Missouri Refinery and Blender Net Production of Normal Butane-Butylene (Thousand Barrels) | ||||||||
| Decade | Year-0 | Year-1 | Year-2 | Year-3 | Year-4 | Year-5 | Year-6 | Year-7 | Year-8 | Year-9 |
|---|---|---|---|---|---|---|---|---|---|---|
| 1990's | 963 | 746 | 659 | 68 | -22 | 46 | -152 | |||
| 2000's | 427 | -233 | 8 | -1,627 | -2,066 | -2,463 | -859 | -1,156 | -1,327 | -1,960 |
| 2010's | -2,212 | -2,404 | -1,572 | -1,651 | -2,671 | -2,250 | -2,429 | -2,708 | -3,266 | -3,094 |
| 2020's | -2,377 | -2,148 | -- | -- |
| - = No Data Reported; -- = Not Applicable; NA = Not Available; W = Withheld to avoid disclosure of individual company data. |
| Release Date: 8/30/2024 |
| Next Release Date: 8/29/2025 |