|
Download Data (XLS File) |
|
||||||||
|
||||||||
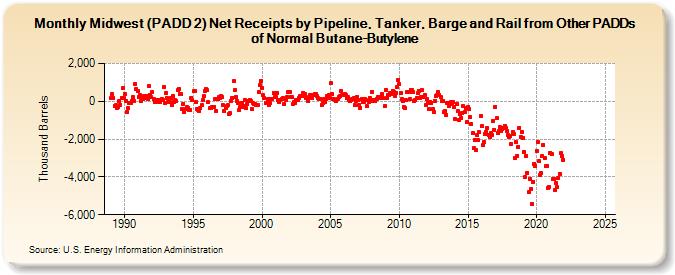
| Midwest (PADD 2) Net Receipts by Pipeline, Tanker, Barge and Rail from Other PADDs of Normal Butane-Butylene (Thousand Barrels) | ||||||||
| Year | Jan | Feb | Mar | Apr | May | Jun | Jul | Aug | Sep | Oct | Nov | Dec |
|---|---|---|---|---|---|---|---|---|---|---|---|---|
| 1989 | 175 | 362 | 180 | -228 | -215 | -343 | -287 | 23 | -171 | 187 | 688 | 172 |
| 1990 | 403 | 38 | -560 | -346 | -75 | -103 | 32 | 206 | 3 | 893 | 661 | 531 |
| 1991 | 222 | 319 | 7 | 181 | 137 | 279 | 151 | 284 | 100 | 785 | 329 | 238 |
| 1992 | 482 | 103 | -44 | 45 | 67 | -23 | 65 | -23 | 130 | 47 | 751 | -67 |
| 1993 | 437 | 182 | -64 | -29 | 169 | -218 | 305 | -12 | 55 | 18 | 579 | 655 |
| 1994 | 391 | 380 | -412 | -124 | -590 | -405 | -321 | -338 | -453 | -449 | 188 | 50 |
| 1995 | 527 | 535 | -59 | -401 | -444 | -492 | -370 | -201 | 57 | 262 | 545 | 653 |
| 1996 | 577 | -64 | -377 | -355 | -305 | -281 | -284 | 126 | -506 | 111 | 205 | 181 |
| 1997 | 278 | 234 | -221 | -539 | -360 | -237 | -213 | -666 | -645 | 36 | 189 | 1,058 |
| 1998 | 571 | 208 | 34 | -102 | -440 | -300 | -66 | -301 | -255 | 57 | -379 | -121 |
| 1999 | 18 | 88 | 6 | -398 | -89 | -123 | -151 | -183 | -202 | 490 | 853 | 1,070 |
| 2000 | 706 | 312 | 161 | -96 | -99 | 100 | -199 | -102 | 110 | 130 | 452 | 228 |
| 2001 | 233 | 439 | 92 | -57 | 46 | 125 | 151 | -153 | 117 | 86 | 228 | 514 |
| 2002 | 490 | 241 | 223 | -132 | -40 | -76 | 87 | 88 | 166 | 264 | 282 | 268 |
| 2003 | 441 | 370 | 196 | 148 | 32 | 219 | 315 | 335 | 176 | 355 | 392 | 399 |
| 2004 | 266 | 157 | 120 | 125 | -193 | -109 | 112 | -17 | 108 | 260 | 309 | 156 |
| 2005 | 946 | 381 | 124 | 105 | 73 | -9 | 135 | 213 | 285 | 545 | 317 | 312 |
| 2006 | 364 | 315 | 170 | 222 | 50 | 13 | 92 | 117 | 174 | -219 | 33 | 252 |
| 2007 | 56 | -189 | -353 | 118 | -44 | -19 | 100 | 66 | -274 | -53 | 179 | 44 |
| 2008 | 506 | 18 | 60 | -6 | 122 | 224 | 248 | 249 | 196 | 369 | 155 | -259 |
| 2009 | 620 | 188 | 324 | 325 | 439 | 371 | 566 | 505 | 296 | 458 | 742 | 1,140 |
| 2010 | 891 | 433 | 99 | 10 | -294 | -359 | 44 | 480 | 516 | 98 | 608 | 608 |
| 2011 | 494 | 15 | 68 | 165 | 430 | 534 | 185 | 207 | 574 | 238 | 330 | -184 |
| 2012 | 108 | -70 | -418 | -12 | -66 | -428 | -545 | 36 | 277 | 342 | 489 | 323 |
| 2013 | 205 | 15 | 20 | -580 | -522 | -722 | -68 | -251 | -112 | -58 | -130 | -46 |
| 2014 | -292 | -952 | -137 | -522 | -994 | -689 | -879 | -601 | -245 | -561 | -348 | -1,120 |
| 2015 | -299 | -434 | -847 | -1,227 | -1,694 | -2,493 | -2,024 | -2,597 | -1,799 | -2,062 | -1,648 | -785 |
| 2016 | -1,327 | -2,338 | -2,141 | -1,739 | -1,605 | -1,425 | -1,784 | -1,870 | -1,692 | -1,772 | -1,017 | -1,493 |
| 2017 | -287 | -906 | -1,676 | -1,591 | -1,375 | -1,598 | -1,466 | -1,435 | -1,286 | -1,406 | -1,570 | -1,774 |
| 2018 | -1,872 | -1,815 | -2,246 | -1,625 | -1,751 | -2,997 | -2,171 | -2,879 | -2,399 | -1,388 | -1,872 | -1,615 |
| 2019 | -1,928 | -2,677 | -3,982 | -2,917 | -3,792 | -4,818 | -4,106 | -4,632 | -5,438 | -4,246 | -3,298 | -3,428 |
| 2020 | -2,612 | -2,159 | -3,180 | -3,909 | -3,810 | -2,881 | -2,302 | -3,023 | -3,437 | -3,422 | -4,568 | -4,526 |
| 2021 | -2,709 | -2,787 | -4,126 | -4,091 | -4,702 | -4,325 | -4,545 | -4,033 | -3,832 | -2,752 | -2,914 | -3,088 |
| 2022 | -- | -- | -- | -- | -- | -- | -- | -- | -- | -- | -- | -- |
| 2023 | -- | -- | -- | -- | -- | -- | -- | -- | -- | -- | -- | -- |
| 2024 | -- | |||||||||||
| - = No Data Reported; -- = Not Applicable; NA = Not Available; W = Withheld to avoid disclosure of individual company data. |
| Release Date: 3/29/2024 |
| Next Release Date: 4/30/2024 |
Referring Pages: