|
Download Data (XLS File) |
|
||||||||
|
||||||||
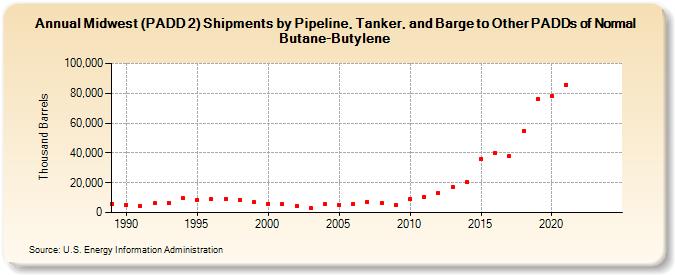
| Midwest (PADD 2) Shipments by Pipeline, Tanker, and Barge to Other PADDs of Normal Butane-Butylene (Thousand Barrels) | ||||||||
| Decade | Year-0 | Year-1 | Year-2 | Year-3 | Year-4 | Year-5 | Year-6 | Year-7 | Year-8 | Year-9 |
|---|---|---|---|---|---|---|---|---|---|---|
| 1980's | 5,901 | |||||||||
| 1990's | 5,295 | 4,429 | 6,173 | 6,596 | 9,746 | 8,613 | 8,831 | 9,148 | 8,716 | 7,192 |
| 2000's | 5,817 | 5,709 | 4,431 | 2,758 | 5,569 | 5,206 | 5,770 | 7,195 | 6,491 | 4,896 |
| 2010's | 9,228 | 10,679 | 13,211 | 17,149 | 20,483 | 36,046 | 40,236 | 37,606 | 54,908 | 76,325 |
| 2020's | 78,209 | 85,749 | -- | -- |
| - = No Data Reported; -- = Not Applicable; NA = Not Available; W = Withheld to avoid disclosure of individual company data. |
| Release Date: 8/30/2024 |
| Next Release Date: 8/29/2025 |