|
Download Data (XLS File) |
|
||||||||
|
||||||||
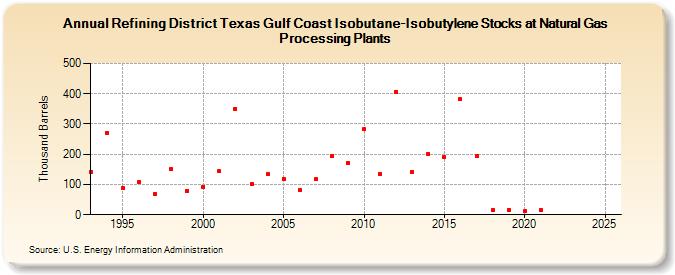
| Refining District Texas Gulf Coast Isobutane-Isobutylene Stocks at Natural Gas Processing Plants (Thousand Barrels) | ||||||||
| Decade | Year-0 | Year-1 | Year-2 | Year-3 | Year-4 | Year-5 | Year-6 | Year-7 | Year-8 | Year-9 |
|---|---|---|---|---|---|---|---|---|---|---|
| 1990's | 141 | 271 | 88 | 107 | 68 | 150 | 80 | |||
| 2000's | 93 | 143 | 351 | 101 | 133 | 119 | 83 | 117 | 193 | 172 |
| 2010's | 282 | 135 | 407 | 141 | 201 | 190 | 382 | 193 | 14 | 17 |
| 2020's | 11 | 14 | -- | -- |
| - = No Data Reported; -- = Not Applicable; NA = Not Available; W = Withheld to avoid disclosure of individual company data. |
| Release Date: 3/29/2024 |
| Next Release Date: 8/30/2024 |