|
Download Data (XLS File) |
|
||||||||
|
||||||||
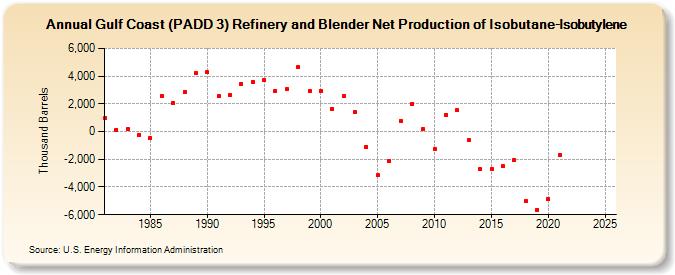
| Gulf Coast (PADD 3) Refinery and Blender Net Production of Isobutane-Isobutylene (Thousand Barrels) | ||||||||
| Decade | Year-0 | Year-1 | Year-2 | Year-3 | Year-4 | Year-5 | Year-6 | Year-7 | Year-8 | Year-9 |
|---|---|---|---|---|---|---|---|---|---|---|
| 1980's | 965 | 144 | 195 | -216 | -460 | 2,589 | 2,092 | 2,841 | 4,220 | |
| 1990's | 4,262 | 2,563 | 2,639 | 3,462 | 3,589 | 3,703 | 2,955 | 3,036 | 4,651 | 2,939 |
| 2000's | 2,940 | 1,653 | 2,544 | 1,389 | -1,113 | -3,166 | -2,126 | 787 | 2,006 | 182 |
| 2010's | -1,280 | 1,230 | 1,520 | -642 | -2,730 | -2,689 | -2,512 | -2,054 | -5,002 | -5,626 |
| 2020's | -4,875 | -1,676 | -- | -- |
| - = No Data Reported; -- = Not Applicable; NA = Not Available; W = Withheld to avoid disclosure of individual company data. |
| Release Date: 8/30/2024 |
| Next Release Date: 8/29/2025 |