|
Download Data (XLS File) |
|
||||||||
|
||||||||
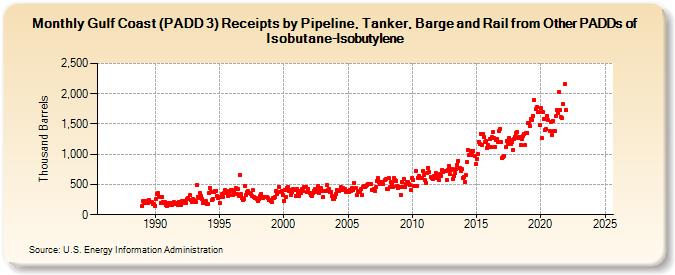
| Gulf Coast (PADD 3) Receipts by Pipeline, Tanker, Barge and Rail from Other PADDs of Isobutane-Isobutylene (Thousand Barrels) | ||||||||
| Year | Jan | Feb | Mar | Apr | May | Jun | Jul | Aug | Sep | Oct | Nov | Dec |
|---|---|---|---|---|---|---|---|---|---|---|---|---|
| 1986 | -- | -- | -- | -- | -- | -- | -- | -- | -- | -- | -- | -- |
| 1987 | -- | -- | -- | -- | -- | -- | -- | -- | -- | -- | -- | -- |
| 1988 | -- | -- | -- | -- | -- | -- | -- | -- | -- | -- | -- | -- |
| 1989 | 143 | 224 | 187 | 232 | 224 | 197 | 250 | 204 | 207 | 202 | 172 | 174 |
| 1990 | 151 | 263 | 338 | 362 | 296 | 198 | 291 | 218 | 193 | 204 | 160 | 137 |
| 1991 | 174 | 199 | 200 | 167 | 161 | 169 | 205 | 179 | 189 | 156 | 211 | 167 |
| 1992 | 157 | 221 | 187 | 227 | 197 | 196 | 265 | 272 | 318 | 236 | 213 | 258 |
| 1993 | 238 | 227 | 205 | 485 | 297 | 278 | 356 | 309 | 258 | 190 | 200 | 230 |
| 1994 | 177 | 179 | 351 | 439 | 372 | 243 | 267 | 368 | 384 | 398 | 312 | 283 |
| 1995 | 196 | 285 | 336 | 296 | 356 | 405 | 395 | 366 | 316 | 318 | 398 | 405 |
| 1996 | 416 | 332 | 376 | 440 | 348 | 433 | 316 | 654 | 336 | 271 | 244 | 268 |
| 1997 | 478 | 323 | 375 | 387 | 363 | 337 | 302 | 403 | 289 | 271 | 272 | 263 |
| 1998 | 234 | 259 | 314 | 348 | 285 | 279 | 299 | 294 | 288 | 272 | 242 | 246 |
| 1999 | 233 | 207 | 276 | 274 | 287 | 399 | 338 | 377 | 466 | 378 | 384 | 326 |
| 2000 | 231 | 405 | 288 | 447 | 465 | 384 | 408 | 321 | 379 | 421 | 402 | 315 |
| 2001 | 421 | 378 | 316 | 388 | 358 | 417 | 396 | 460 | 457 | 455 | 370 | 433 |
| 2002 | 358 | 318 | 311 | 363 | 392 | 421 | 412 | 380 | 469 | 359 | 428 | 439 |
| 2003 | 395 | 291 | 394 | 394 | 495 | 401 | 428 | 370 | 372 | 302 | 253 | 266 |
| 2004 | 300 | 349 | 401 | 400 | 386 | 451 | 412 | 444 | 428 | 429 | 376 | 375 |
| 2005 | 395 | 379 | 411 | 397 | 444 | 403 | 531 | 439 | 327 | 400 | 377 | 384 |
| 2006 | 419 | 332 | 461 | 474 | 462 | 478 | 490 | 500 | 510 | 501 | 416 | 411 |
| 2007 | 422 | 384 | 454 | 552 | 600 | 546 | 515 | 540 | 538 | 503 | 571 | 585 |
| 2008 | 420 | 417 | 600 | 466 | 536 | 512 | 464 | 605 | 581 | 565 | 479 | 440 |
| 2009 | 463 | 332 | 546 | 466 | 592 | 457 | 516 | 539 | 545 | 515 | 486 | 411 |
| 2010 | 614 | 573 | 479 | 717 | 480 | 612 | 642 | 610 | 606 | 601 | 729 | 661 |
| 2011 | 569 | 526 | 682 | 779 | 699 | 626 | 612 | 583 | 641 | 637 | 687 | 607 |
| 2012 | 616 | 577 | 665 | 642 | 746 | 705 | 722 | 722 | 572 | 746 | 806 | 671 |
| 2013 | 745 | 748 | 592 | 635 | 691 | 748 | 827 | 896 | 764 | 725 | 751 | 615 |
| 2014 | 623 | 543 | 650 | 870 | 1,071 | 981 | 988 | 1,061 | 994 | 1,054 | 964 | 833 |
| 2015 | 918 | 1,009 | 1,209 | 1,166 | 1,342 | 1,160 | 1,336 | 1,291 | 1,208 | 1,216 | 1,097 | 1,148 |
| 2016 | 1,254 | 1,113 | 1,279 | 1,360 | 1,271 | 1,122 | 1,235 | 1,250 | 1,205 | 1,392 | 1,423 | 1,201 |
| 2017 | 935 | 949 | 975 | 1,113 | 1,223 | 1,170 | 1,273 | 1,233 | 1,165 | 1,207 | 1,078 | 1,256 |
| 2018 | 1,292 | 1,355 | 1,368 | 1,263 | 1,291 | 1,155 | 1,253 | 1,294 | 1,335 | 1,147 | 1,354 | 1,359 |
| 2019 | 1,518 | 1,518 | 1,459 | 1,586 | 1,567 | 1,640 | 1,897 | 1,741 | 1,780 | 1,690 | 1,704 | 1,484 |
| 2020 | 1,760 | 1,268 | 1,691 | 1,583 | 1,407 | 1,411 | 1,640 | 1,559 | 1,385 | 1,531 | 1,312 | 1,555 |
| 2021 | 1,391 | 1,389 | 1,624 | 1,735 | 1,688 | 2,034 | 1,728 | 1,609 | 1,595 | 1,822 | 2,159 | 1,734 |
| 2022 | -- | -- | -- | -- | -- | -- | -- | -- | -- | -- | -- | -- |
| 2023 | -- | -- | -- | -- | -- | -- | -- | -- | -- | -- | -- | -- |
| 2024 | -- | |||||||||||
| - = No Data Reported; -- = Not Applicable; NA = Not Available; W = Withheld to avoid disclosure of individual company data. |
| Release Date: 3/29/2024 |
| Next Release Date: 4/30/2024 |