|
Download Data (XLS File) |
|
||||||||
|
||||||||
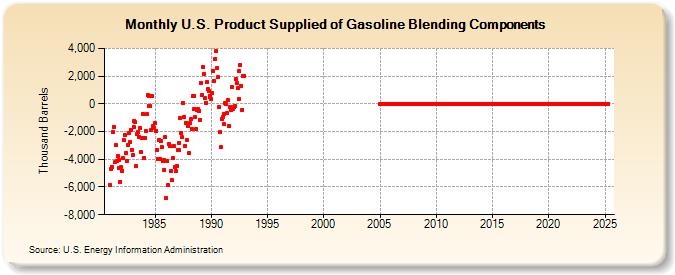
| U.S. Product Supplied of Gasoline Blending Components (Thousand Barrels) | ||||||||
| Year | Jan | Feb | Mar | Apr | May | Jun | Jul | Aug | Sep | Oct | Nov | Dec |
|---|---|---|---|---|---|---|---|---|---|---|---|---|
| 1981 | -5,839 | -4,708 | -4,533 | -2,032 | -1,670 | -4,219 | -2,964 | -4,124 | -3,741 | -4,644 | -4,048 | -5,620 |
| 1982 | -4,565 | -4,821 | -3,940 | -2,611 | -2,232 | -3,543 | -4,120 | -2,944 | -2,077 | -2,786 | -1,864 | -3,297 |
| 1983 | -3,703 | -1,643 | -1,224 | -1,336 | -4,508 | -2,165 | -2,011 | -2,393 | -1,749 | -3,494 | -2,472 | -709 |
| 1984 | -3,887 | -2,430 | -1,976 | -768 | 602 | -156 | 589 | -170 | -1,855 | 543 | -1,580 | -1,741 |
| 1985 | -1,402 | -1,931 | -3,367 | -4,004 | -2,607 | -3,965 | -2,716 | -3,144 | -4,143 | -4,032 | -4,752 | -2,412 |
| 1986 | -6,802 | -4,124 | -5,858 | -2,917 | -3,077 | -4,867 | -5,530 | -3,914 | -3,063 | -4,571 | -4,861 | -4,503 |
| 1987 | -3,330 | -2,813 | -3,341 | -1,030 | -2,081 | -2,420 | 57 | -917 | -3,025 | -1,361 | -2,613 | -1,586 |
| 1988 | -3,548 | -1,415 | -1,125 | -1,820 | 549 | 593 | -347 | -962 | -1,815 | -464 | -380 | -484 |
| 1989 | -1,147 | 1,527 | 624 | 2,663 | 2,143 | 398 | 74 | 1,543 | 1,035 | 931 | 585 | 479 |
| 1990 | 382 | 776 | 2,364 | 1,678 | 3,205 | 3,847 | 2,564 | 1,905 | -235 | -2,059 | -3,117 | -1,088 |
| 1991 | -936 | -748 | -1,481 | 56 | 20 | -673 | 270 | -1,611 | -219 | -445 | 1,179 | -346 |
| 1992 | -260 | -164 | 1,823 | 1,470 | 1,116 | 334 | 2,336 | 2,806 | 1,296 | -424 | 2,035 | 2,040 |
| 2005 | 0 | 0 | 0 | 0 | 0 | 0 | 0 | 0 | 0 | 0 | 0 | 0 |
| 2006 | 0 | 0 | 0 | 0 | 0 | 0 | 0 | 0 | 0 | 0 | 0 | 0 |
| 2007 | 0 | 0 | 0 | 0 | 0 | 0 | 0 | 0 | 0 | 0 | 0 | 0 |
| 2008 | 0 | 0 | 0 | 0 | 0 | 0 | 0 | 0 | 0 | 0 | 0 | 0 |
| 2009 | 0 | 0 | 0 | 0 | 0 | 0 | 0 | 0 | 0 | 0 | 0 | 0 |
| 2010 | 0 | 0 | 0 | 0 | 0 | 0 | 0 | 0 | 0 | 0 | 0 | 0 |
| 2011 | 0 | 0 | 0 | 0 | 0 | 0 | 0 | 0 | 0 | 0 | 0 | 0 |
| 2012 | 0 | 0 | 0 | 0 | 0 | 0 | 0 | 0 | 0 | 0 | 0 | 0 |
| 2013 | 0 | 0 | 0 | 0 | 0 | 0 | 0 | 0 | 0 | 0 | 0 | 0 |
| 2014 | 0 | 0 | 0 | 0 | 0 | 0 | 0 | 0 | 0 | 0 | 0 | 0 |
| 2015 | 0 | 0 | 0 | 0 | 0 | 0 | 0 | 0 | 0 | 0 | 0 | 0 |
| 2016 | 0 | 0 | 0 | 0 | 0 | 0 | 0 | 0 | 0 | 0 | 0 | 0 |
| 2017 | 0 | 0 | 0 | 0 | 0 | 0 | 0 | 0 | 0 | 0 | 0 | 0 |
| 2018 | 0 | 0 | 0 | 0 | 0 | 0 | 0 | 0 | 0 | 0 | 0 | 0 |
| 2019 | 0 | 0 | 0 | 0 | 0 | 0 | 0 | 0 | 0 | 0 | 0 | 0 |
| 2020 | 0 | 0 | 0 | 0 | 0 | 0 | 0 | 0 | 0 | 0 | 0 | 0 |
| 2021 | 0 | 0 | 0 | 0 | 0 | 0 | 0 | 0 | 0 | 0 | 0 | 0 |
| 2022 | 0 | 0 | 0 | 0 | 0 | 0 | 0 | 0 | 0 | 0 | 0 | 0 |
| 2023 | 0 | 0 | 0 | 0 | 0 | 0 | 0 | 0 | 0 | 0 | 0 | 0 |
| 2024 | 0 | |||||||||||
| - = No Data Reported; -- = Not Applicable; NA = Not Available; W = Withheld to avoid disclosure of individual company data. |
| Release Date: 3/29/2024 |
| Next Release Date: 4/30/2024 |