|
Download Data (XLS File) |
|
||||||||
|
||||||||
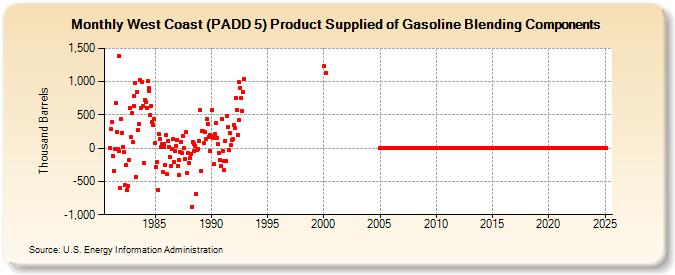
| West Coast (PADD 5) Product Supplied of Gasoline Blending Components (Thousand Barrels) | ||||||||
| Year | Jan | Feb | Mar | Apr | May | Jun | Jul | Aug | Sep | Oct | Nov | Dec |
|---|---|---|---|---|---|---|---|---|---|---|---|---|
| 1981 | 6 | 284 | 389 | -123 | -339 | -15 | 679 | 242 | -14 | -49 | 1,385 | -599 |
| 1982 | 438 | 232 | 23 | -54 | -550 | -256 | -635 | -568 | -182 | 600 | 163 | 525 |
| 1983 | 100 | 787 | 636 | 978 | -433 | 852 | 270 | 358 | 1,018 | 601 | 989 | 635 |
| 1984 | -221 | 717 | 701 | 610 | 1,005 | 898 | 857 | 498 | 630 | 391 | 355 | 445 |
| 1985 | 73 | -279 | -215 | -634 | 215 | 140 | 13 | 65 | -352 | 20 | 61 | -256 |
| 1986 | 194 | -391 | 113 | 22 | -139 | -264 | -19 | 133 | -206 | -41 | 40 | 125 |
| 1987 | -270 | -180 | -401 | -53 | 92 | -70 | 179 | 8 | -158 | 236 | -378 | -77 |
| 1988 | -222 | -146 | -84 | -885 | 90 | 60 | -49 | 36 | -693 | -24 | -6 | 102 |
| 1989 | 580 | -336 | 261 | 259 | 72 | 240 | 136 | 432 | 368 | 165 | -47 | 199 |
| 1990 | 185 | 575 | 157 | -236 | 208 | 377 | 155 | 59 | -72 | -182 | -270 | 439 |
| 1991 | -35 | -200 | -333 | 108 | -192 | 479 | 314 | -31 | 221 | 44 | 123 | 135 |
| 1992 | 356 | 310 | 758 | 577 | 200 | 989 | 423 | 909 | 749 | 560 | 846 | 1,035 |
| 2000 | 1,229 | 1,136 | ||||||||||
| 2005 | 0 | 0 | 0 | 0 | 0 | 0 | 0 | 0 | 0 | 0 | 0 | 0 |
| 2006 | 0 | 0 | 0 | 0 | 0 | 0 | 0 | 0 | 0 | 0 | 0 | 0 |
| 2007 | 0 | 0 | 0 | 0 | 0 | 0 | 0 | 0 | 0 | 0 | 0 | 0 |
| 2008 | 0 | 0 | 0 | 0 | 0 | 0 | 0 | 0 | 0 | 0 | 0 | 0 |
| 2009 | 0 | 0 | 0 | 0 | 0 | 0 | 0 | 0 | 0 | 0 | 0 | 0 |
| 2010 | 0 | 0 | 0 | 0 | 0 | 0 | 0 | 0 | 0 | 0 | 0 | 0 |
| 2011 | 0 | 0 | 0 | 0 | 0 | 0 | 0 | 0 | 0 | 0 | 0 | 0 |
| 2012 | 0 | 0 | 0 | 0 | 0 | 0 | 0 | 0 | 0 | 0 | 0 | 0 |
| 2013 | 0 | 0 | 0 | 0 | 0 | 0 | 0 | 0 | 0 | 0 | 0 | 0 |
| 2014 | 0 | 0 | 0 | 0 | 0 | 0 | 0 | 0 | 0 | 0 | 0 | 0 |
| 2015 | 0 | 0 | 0 | 0 | 0 | 0 | 0 | 0 | 0 | 0 | 0 | 0 |
| 2016 | 0 | 0 | 0 | 0 | 0 | 0 | 0 | 0 | 0 | 0 | 0 | 0 |
| 2017 | 0 | 0 | 0 | 0 | 0 | 0 | 0 | 0 | 0 | 0 | 0 | 0 |
| 2018 | 0 | 0 | 0 | 0 | 0 | 0 | 0 | 0 | 0 | 0 | 0 | 0 |
| 2019 | 0 | 0 | 0 | 0 | 0 | 0 | 0 | 0 | 0 | 0 | 0 | 0 |
| 2020 | 0 | 0 | 0 | 0 | 0 | 0 | 0 | 0 | 0 | 0 | 0 | 0 |
| 2021 | 0 | 0 | 0 | 0 | 0 | 0 | 0 | 0 | 0 | 0 | 0 | 0 |
| 2022 | 0 | 0 | 0 | 0 | 0 | 0 | 0 | 0 | 0 | 0 | 0 | 0 |
| 2023 | 0 | 0 | 0 | 0 | 0 | 0 | 0 | 0 | 0 | 0 | 0 | 0 |
| 2024 | 0 | 0 | 0 | 0 | ||||||||
| - = No Data Reported; -- = Not Applicable; NA = Not Available; W = Withheld to avoid disclosure of individual company data. |
| Release Date: 6/28/2024 |
| Next Release Date: 7/31/2024 |