|
Download Data (XLS File) |
|
||||||||
|
||||||||
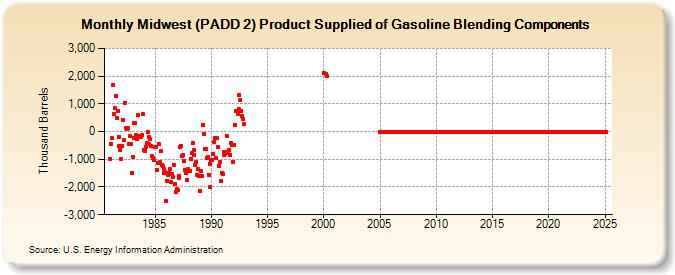
| Midwest (PADD 2) Product Supplied of Gasoline Blending Components (Thousand Barrels) | ||||||||
| Year | Jan | Feb | Mar | Apr | May | Jun | Jul | Aug | Sep | Oct | Nov | Dec |
|---|---|---|---|---|---|---|---|---|---|---|---|---|
| 1981 | -973 | -439 | -243 | 1,688 | 619 | 860 | 1,278 | 476 | 740 | -184 | -510 | -655 |
| 1982 | -992 | -509 | 415 | -306 | 1,044 | 119 | 98 | 114 | -431 | -166 | -463 | -1,495 |
| 1983 | -915 | -228 | 319 | 292 | -130 | -261 | 583 | -150 | -214 | -205 | -125 | 619 |
| 1984 | -668 | -710 | -551 | -420 | -34 | -204 | -444 | -282 | -512 | -898 | -962 | -1,039 |
| 1985 | -570 | -540 | -1,384 | -1,126 | -435 | -1,110 | -717 | -1,201 | -1,232 | -1,485 | -1,359 | -1,477 |
| 1986 | -2,511 | -1,776 | -1,583 | -1,500 | -1,363 | -1,806 | -1,536 | -1,626 | -1,218 | -1,876 | -2,178 | -2,055 |
| 1987 | -2,124 | -1,660 | -1,611 | -550 | -506 | -880 | -854 | -1,051 | -1,396 | -1,479 | -1,733 | -1,365 |
| 1988 | -1,424 | -1,408 | -976 | -781 | -401 | -669 | -860 | -1,191 | -1,102 | -1,551 | -1,354 | -1,617 |
| 1989 | -2,157 | -1,409 | -1,609 | 251 | -93 | -633 | -637 | -955 | -932 | -1,562 | -1,156 | -2,004 |
| 1990 | -1,040 | -1,025 | -797 | -377 | -218 | -961 | -245 | -564 | -1,226 | -1,100 | -1,792 | -1,488 |
| 1991 | -1,532 | -859 | -731 | -814 | -743 | -170 | -788 | -683 | -851 | -411 | -476 | -1,095 |
| 1992 | -499 | 229 | 745 | 753 | 650 | 804 | 1,330 | 1,128 | 744 | 547 | 438 | 261 |
| 2000 | 2,109 | 2,080 | 2,013 | |||||||||
| 2005 | 0 | 0 | 0 | 0 | 0 | 0 | 0 | 0 | 0 | 0 | 0 | 0 |
| 2006 | 0 | 0 | 0 | 0 | 0 | 0 | 0 | 0 | 0 | 0 | 0 | 0 |
| 2007 | 0 | 0 | 0 | 0 | 0 | 0 | 0 | 0 | 0 | 0 | 0 | 0 |
| 2008 | 0 | 0 | 0 | 0 | 0 | 0 | 0 | 0 | 0 | 0 | 0 | 0 |
| 2009 | 0 | 0 | 0 | 0 | 0 | 0 | 0 | 0 | 0 | 0 | 0 | 0 |
| 2010 | 0 | 0 | 0 | 0 | 0 | 0 | 0 | 0 | 0 | 0 | 0 | 0 |
| 2011 | 0 | 0 | 0 | 0 | 0 | 0 | 0 | 0 | 0 | 0 | 0 | 0 |
| 2012 | 0 | 0 | 0 | 0 | 0 | 0 | 0 | 0 | 0 | 0 | 0 | 0 |
| 2013 | 0 | 0 | 0 | 0 | 0 | 0 | 0 | 0 | 0 | 0 | 0 | 0 |
| 2014 | 0 | 0 | 0 | 0 | 0 | 0 | 0 | 0 | 0 | 0 | 0 | 0 |
| 2015 | 0 | 0 | 0 | 0 | 0 | 0 | 0 | 0 | 0 | 0 | 0 | 0 |
| 2016 | 0 | 0 | 0 | 0 | 0 | 0 | 0 | 0 | 0 | 0 | 0 | 0 |
| 2017 | 0 | 0 | 0 | 0 | 0 | 0 | 0 | 0 | 0 | 0 | 0 | 0 |
| 2018 | 0 | 0 | 0 | 0 | 0 | 0 | 0 | 0 | 0 | 0 | 0 | 0 |
| 2019 | 0 | 0 | 0 | 0 | 0 | 0 | 0 | 0 | 0 | 0 | 0 | 0 |
| 2020 | 0 | 0 | 0 | 0 | 0 | 0 | 0 | 0 | 0 | 0 | 0 | 0 |
| 2021 | 0 | 0 | 0 | 0 | 0 | 0 | 0 | 0 | 0 | 0 | 0 | 0 |
| 2022 | 0 | 0 | 0 | 0 | 0 | 0 | 0 | 0 | 0 | 0 | 0 | 0 |
| 2023 | 0 | 0 | 0 | 0 | 0 | 0 | 0 | 0 | 0 | 0 | 0 | 0 |
| 2024 | 0 | |||||||||||
| - = No Data Reported; -- = Not Applicable; NA = Not Available; W = Withheld to avoid disclosure of individual company data. |
| Release Date: 3/29/2024 |
| Next Release Date: 4/30/2024 |