|
Download Data (XLS File) |
|
||||||||
|
||||||||
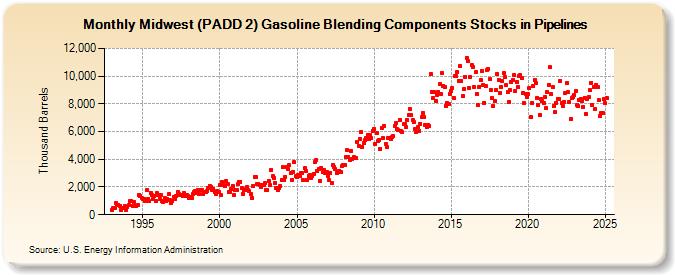
| Midwest (PADD 2) Gasoline Blending Components Stocks in Pipelines (Thousand Barrels) | ||||||||
| Year | Jan | Feb | Mar | Apr | May | Jun | Jul | Aug | Sep | Oct | Nov | Dec |
|---|---|---|---|---|---|---|---|---|---|---|---|---|
| 1993 | 326 | 450 | 486 | 836 | 709 | 692 | 634 | 350 | 461 | 476 | 603 | 369 |
| 1994 | 549 | 678 | 962 | 1,003 | 660 | 938 | 604 | 603 | 681 | 1,439 | 1,335 | 1,227 |
| 1995 | 1,115 | 1,157 | 986 | 1,772 | 1,134 | 957 | 1,599 | 1,439 | 1,125 | 1,319 | 995 | 1,531 |
| 1996 | 1,415 | 1,138 | 1,448 | 997 | 936 | 1,193 | 998 | 1,150 | 1,467 | 1,051 | 812 | 970 |
| 1997 | 1,297 | 1,160 | 1,383 | 1,640 | 1,497 | 1,410 | 1,388 | 1,383 | 1,567 | 1,379 | 1,433 | 1,384 |
| 1998 | 1,241 | 1,276 | 1,198 | 1,494 | 1,647 | 1,747 | 1,535 | 1,761 | 1,489 | 1,794 | 1,786 | 1,464 |
| 1999 | 1,627 | 1,671 | 1,683 | 1,931 | 2,089 | 2,015 | 1,794 | 1,877 | 1,631 | 1,515 | 1,740 | 1,645 |
| 2000 | 2,139 | 1,394 | 2,360 | 2,159 | 2,076 | 2,422 | 2,208 | 1,656 | 1,627 | 1,834 | 2,103 | 1,425 |
| 2001 | 1,807 | 1,801 | 2,180 | 2,394 | 2,394 | 1,902 | 1,513 | 1,771 | 1,849 | 1,993 | 1,770 | 1,690 |
| 2002 | 1,467 | 1,207 | 2,076 | 2,738 | 2,720 | 2,213 | 2,244 | 2,162 | 2,033 | 2,116 | 2,128 | 2,265 |
| 2003 | 1,785 | 1,760 | 2,432 | 2,148 | 3,261 | 2,774 | 2,656 | 2,290 | 1,927 | 1,777 | 1,897 | 2,048 |
| 2004 | 2,517 | 3,411 | 2,527 | 2,744 | 3,450 | 3,303 | 3,557 | 3,022 | 2,531 | 3,070 | 3,768 | 2,773 |
| 2005 | 2,693 | 2,837 | 2,765 | 3,028 | 3,027 | 2,498 | 3,348 | 3,147 | 2,533 | 2,798 | 2,896 | 2,669 |
| 2006 | 2,824 | 2,955 | 3,776 | 3,922 | 3,119 | 3,284 | 2,444 | 3,402 | 3,056 | 3,229 | 3,006 | 3,104 |
| 2007 | 2,823 | 2,478 | 3,025 | 2,267 | 3,582 | 3,455 | 3,270 | 3,032 | 3,110 | 3,186 | 3,057 | 3,494 |
| 2008 | 3,606 | 3,578 | 4,148 | 4,675 | 4,147 | 3,951 | 4,626 | 3,989 | 4,145 | 4,087 | 4,087 | 5,240 |
| 2009 | 4,985 | 5,479 | 5,979 | 4,915 | 5,181 | 5,388 | 5,556 | 5,774 | 5,453 | 5,736 | 5,522 | 6,047 |
| 2010 | 6,193 | 5,120 | 5,860 | 5,297 | 5,399 | 4,776 | 6,246 | 5,544 | 6,413 | 5,106 | 4,858 | 5,511 |
| 2011 | 5,525 | 5,452 | 5,602 | 5,670 | 6,379 | 6,634 | 6,209 | 6,093 | 6,823 | 6,060 | 5,937 | 6,511 |
| 2012 | 6,533 | 6,306 | 6,825 | 7,171 | 7,609 | 7,162 | 6,815 | 6,660 | 6,149 | 5,970 | 6,300 | 6,064 |
| 2013 | 6,563 | 7,016 | 7,364 | 7,016 | 6,483 | 6,316 | 6,464 | 6,426 | 10,150 | 8,847 | 8,414 | 8,818 |
| 2014 | 8,229 | 8,667 | 8,886 | 9,396 | 8,739 | 10,231 | 9,309 | 9,198 | 7,873 | 8,047 | 8,000 | 8,710 |
| 2015 | 8,945 | 9,149 | 8,443 | 10,033 | 9,987 | 10,304 | 9,679 | 10,721 | 9,667 | 8,568 | 9,079 | 9,966 |
| 2016 | 11,327 | 11,065 | 9,174 | 9,966 | 10,770 | 10,681 | 9,245 | 10,264 | 8,726 | 7,888 | 9,234 | 9,698 |
| 2017 | 10,388 | 9,353 | 8,075 | 9,303 | 10,450 | 10,503 | 9,756 | 9,008 | 8,410 | 7,816 | 8,172 | 9,024 |
| 2018 | 10,150 | 9,725 | 8,773 | 9,211 | 9,647 | 10,226 | 9,922 | 9,339 | 8,861 | 8,159 | 8,993 | 9,558 |
| 2019 | 9,730 | 10,094 | 8,926 | 9,565 | 9,216 | 9,994 | 10,064 | 9,862 | 8,803 | 8,029 | 8,740 | 8,515 |
| 2020 | 8,688 | 9,154 | 7,075 | 8,056 | 9,262 | 9,696 | 9,521 | 8,453 | 7,909 | 7,195 | 8,349 | 8,188 |
| 2021 | 8,075 | 8,499 | 7,693 | 8,862 | 9,385 | 10,638 | 8,709 | 9,193 | 7,855 | 7,421 | 8,069 | 8,377 |
| 2022 | 8,378 | 9,679 | 8,028 | 7,822 | 8,142 | 8,797 | 9,492 | 8,827 | 8,148 | 6,930 | 8,411 | 8,478 |
| 2023 | 8,321 | 8,589 | 7,592 | 7,592 | 8,156 | 8,699 | 8,473 | 8,093 | 8,784 | 7,079 | 8,211 | 8,174 |
| 2024 | 8,964 | |||||||||||
| - = No Data Reported; -- = Not Applicable; NA = Not Available; W = Withheld to avoid disclosure of individual company data. |
| Release Date: 3/29/2024 |
| Next Release Date: 4/30/2024 |