|
Download Data (XLS File) |
|
||||||||
|
||||||||
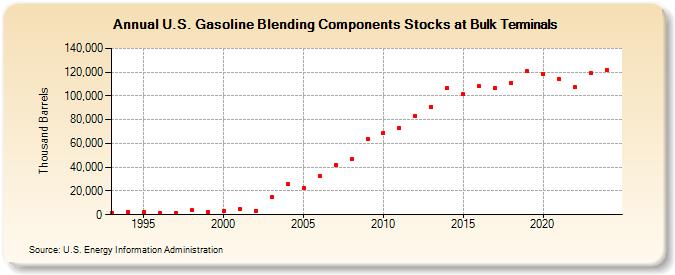
| U.S. Gasoline Blending Components Stocks at Bulk Terminals (Thousand Barrels) | ||||||||
| Decade | Year-0 | Year-1 | Year-2 | Year-3 | Year-4 | Year-5 | Year-6 | Year-7 | Year-8 | Year-9 |
|---|---|---|---|---|---|---|---|---|---|---|
| 1990's | 1,512 | 2,430 | 2,096 | 1,196 | 1,760 | 3,936 | 2,446 | |||
| 2000's | 3,141 | 4,487 | 3,363 | 14,896 | 25,591 | 22,370 | 32,485 | 41,594 | 46,483 | 63,759 |
| 2010's | 69,116 | 72,994 | 83,048 | 90,723 | 106,868 | 101,223 | 108,020 | 106,830 | 111,198 | 120,721 |
| 2020's | 118,272 | 113,987 | 107,218 | 119,654 |
| - = No Data Reported; -- = Not Applicable; NA = Not Available; W = Withheld to avoid disclosure of individual company data. |
| Release Date: 3/29/2024 |
| Next Release Date: 8/30/2024 |