|
Download Data (XLS File) |
|
||||||||
|
||||||||
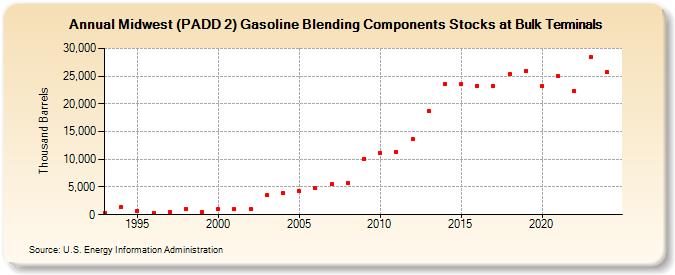
| Midwest (PADD 2) Gasoline Blending Components Stocks at Bulk Terminals (Thousand Barrels) | ||||||||
| Decade | Year-0 | Year-1 | Year-2 | Year-3 | Year-4 | Year-5 | Year-6 | Year-7 | Year-8 | Year-9 |
|---|---|---|---|---|---|---|---|---|---|---|
| 1990's | 338 | 1,322 | 725 | 397 | 556 | 1,100 | 554 | |||
| 2000's | 955 | 1,019 | 990 | 3,514 | 3,844 | 4,202 | 4,850 | 5,464 | 5,722 | 10,095 |
| 2010's | 11,157 | 11,389 | 13,672 | 18,763 | 23,664 | 23,505 | 23,263 | 23,178 | 25,318 | 25,988 |
| 2020's | 23,255 | 25,026 | 22,318 | 28,363 |
| - = No Data Reported; -- = Not Applicable; NA = Not Available; W = Withheld to avoid disclosure of individual company data. |
| Release Date: 3/29/2024 |
| Next Release Date: 8/30/2024 |