|
Download Data (XLS File) |
|
||||||||
|
||||||||
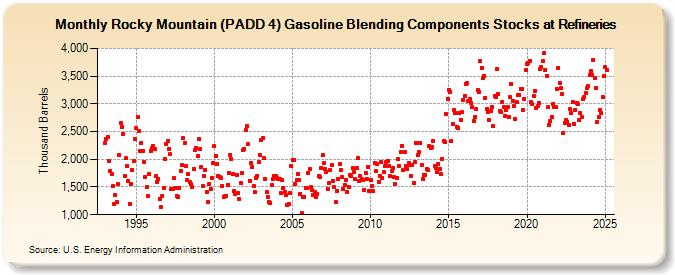
| Rocky Mountain (PADD 4) Gasoline Blending Components Stocks at Refineries (Thousand Barrels) | ||||||||
| Year | Jan | Feb | Mar | Apr | May | Jun | Jul | Aug | Sep | Oct | Nov | Dec |
|---|---|---|---|---|---|---|---|---|---|---|---|---|
| 1993 | 2,288 | 2,362 | 2,405 | 1,972 | 1,780 | 1,735 | 1,514 | 1,185 | 1,354 | 1,229 | 1,552 | 2,082 |
| 1994 | 2,647 | 2,581 | 2,462 | 1,690 | 2,016 | 1,875 | 1,617 | 1,202 | 1,546 | 1,802 | 1,968 | 2,357 |
| 1995 | 2,561 | 2,762 | 2,518 | 2,151 | 2,287 | 2,153 | 1,958 | 1,677 | 1,496 | 1,341 | 1,734 | 2,145 |
| 1996 | 2,201 | 2,242 | 2,181 | 1,692 | 1,595 | 1,637 | 1,292 | 1,143 | 1,342 | 1,477 | 2,000 | 2,275 |
| 1997 | 2,330 | 2,194 | 2,089 | 1,468 | 1,469 | 1,664 | 1,490 | 1,343 | 1,322 | 1,480 | 1,790 | 1,889 |
| 1998 | 2,386 | 2,301 | 1,882 | 1,629 | 1,728 | 1,596 | 1,547 | 1,507 | 1,830 | 2,166 | 2,203 | 2,062 |
| 1999 | 2,374 | 2,193 | 1,866 | 1,516 | 1,694 | 1,814 | 1,407 | 1,228 | 1,553 | 1,465 | 1,669 | 1,941 |
| 2000 | 2,238 | 2,056 | 1,922 | 1,707 | 1,686 | 1,655 | 1,518 | 1,317 | 1,344 | 1,331 | 1,544 | 1,759 |
| 2001 | 2,082 | 2,007 | 1,726 | 1,427 | 1,370 | 1,712 | 1,395 | 1,276 | 1,570 | 1,744 | 2,175 | 2,185 |
| 2002 | 2,520 | 2,599 | 2,274 | 1,617 | 1,930 | 1,853 | 1,519 | 1,404 | 1,671 | 1,706 | 1,943 | 2,074 |
| 2003 | 2,339 | 2,376 | 2,022 | 1,649 | 1,414 | 1,320 | 1,226 | 1,214 | 1,527 | 1,651 | 1,702 | 1,698 |
| 2004 | 1,659 | 1,652 | 1,639 | 1,387 | 1,620 | 1,490 | 1,401 | 1,351 | 1,172 | 1,196 | 1,395 | 1,885 |
| 2005 | 1,995 | 1,990 | 1,553 | 1,634 | 1,733 | 1,619 | 1,382 | 1,030 | 1,327 | 1,328 | 1,482 | 1,488 |
| 2006 | 1,759 | 1,823 | 1,492 | 1,441 | 1,349 | 1,404 | 1,311 | 1,373 | 1,707 | 1,686 | 1,848 | 2,069 |
| 2007 | 1,926 | 1,829 | 1,779 | 1,462 | 1,566 | 1,806 | 1,898 | 1,617 | 1,491 | 1,222 | 1,426 | 1,639 |
| 2008 | 1,914 | 1,808 | 1,679 | 1,457 | 1,540 | 1,629 | 1,418 | 1,492 | 1,719 | 1,693 | 1,835 | 1,770 |
| 2009 | 1,643 | 1,838 | 2,018 | 1,606 | 1,690 | 1,641 | 1,619 | 1,450 | 1,756 | 1,650 | 1,859 | 1,429 |
| 2010 | 1,627 | 1,519 | 1,426 | 1,924 | 1,785 | 1,911 | 1,595 | 1,707 | 1,949 | 1,670 | 1,765 | 1,886 |
| 2011 | 1,956 | 1,967 | 1,885 | 1,705 | 1,793 | 1,837 | 1,673 | 1,554 | 1,662 | 1,998 | 1,885 | 2,130 |
| 2012 | 2,244 | 1,798 | 2,139 | 1,883 | 1,818 | 1,940 | 1,893 | 1,699 | 1,904 | 1,578 | 1,948 | 2,298 |
| 2013 | 2,077 | 2,133 | 2,295 | 1,896 | 1,638 | 1,722 | 1,722 | 1,817 | 1,800 | 2,237 | 2,212 | 2,225 |
| 2014 | 2,322 | 1,882 | 1,845 | 1,764 | 1,919 | 1,831 | 1,728 | 2,012 | 2,326 | 2,309 | 2,814 | 3,093 |
| 2015 | 3,251 | 3,222 | 2,331 | 2,633 | 2,897 | 2,839 | 2,591 | 2,564 | 2,829 | 2,717 | 2,844 | 3,075 |
| 2016 | 3,140 | 3,360 | 3,380 | 3,055 | 3,093 | 3,022 | 2,934 | 2,685 | 2,761 | 2,901 | 3,253 | 3,213 |
| 2017 | 3,780 | 3,651 | 3,460 | 3,500 | 3,110 | 2,904 | 2,850 | 2,707 | 2,863 | 2,950 | 2,596 | 3,150 |
| 2018 | 3,122 | 3,623 | 3,182 | 2,878 | 2,851 | 3,037 | 2,935 | 2,788 | 2,893 | 2,937 | 2,769 | 3,126 |
| 2019 | 3,365 | 3,057 | 2,957 | 2,720 | 3,036 | 3,155 | 3,164 | 3,270 | 3,276 | 2,888 | 3,095 | 3,609 |
| 2020 | 3,727 | 3,739 | 3,778 | 3,040 | 2,988 | 3,148 | 3,239 | 2,929 | 2,953 | 3,023 | 3,623 | 3,657 |
| 2021 | 3,772 | 3,908 | 3,607 | 3,508 | 2,939 | 2,626 | 2,687 | 2,763 | 3,004 | 2,941 | 2,946 | 3,273 |
| 2022 | 3,652 | 3,375 | 3,282 | 3,186 | 2,478 | 2,655 | 2,707 | 2,681 | 2,610 | 2,910 | 2,828 | 3,041 |
| 2023 | 2,640 | 2,887 | 3,009 | 3,005 | 2,702 | 2,721 | 2,760 | 3,098 | 3,116 | 3,198 | 3,290 | 3,316 |
| 2024 | 3,523 | |||||||||||
| - = No Data Reported; -- = Not Applicable; NA = Not Available; W = Withheld to avoid disclosure of individual company data. |
| Release Date: 3/29/2024 |
| Next Release Date: 4/30/2024 |