|
Download Data (XLS File) |
|
||||||||
|
||||||||
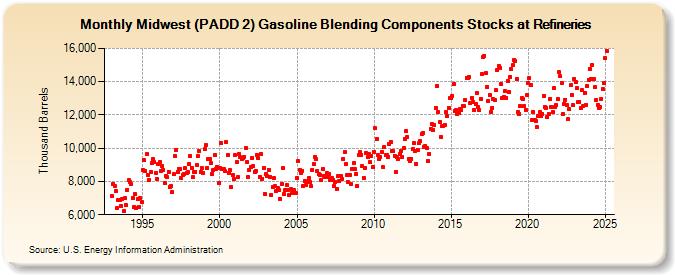
| Midwest (PADD 2) Gasoline Blending Components Stocks at Refineries (Thousand Barrels) | ||||||||
| Year | Jan | Feb | Mar | Apr | May | Jun | Jul | Aug | Sep | Oct | Nov | Dec |
|---|---|---|---|---|---|---|---|---|---|---|---|---|
| 1993 | 7,129 | 7,834 | 7,708 | 7,411 | 6,406 | 6,904 | 6,879 | 6,551 | 6,959 | 6,205 | 6,981 | 6,555 |
| 1994 | 7,511 | 8,061 | 7,970 | 7,825 | 7,003 | 6,463 | 7,216 | 6,412 | 6,917 | 6,472 | 6,993 | 6,738 |
| 1995 | 8,702 | 9,271 | 8,628 | 9,630 | 8,416 | 8,100 | 8,561 | 9,120 | 9,328 | 9,168 | 8,538 | 8,169 |
| 1996 | 9,023 | 9,146 | 8,628 | 8,948 | 8,696 | 7,916 | 8,329 | 8,248 | 8,583 | 7,672 | 7,721 | 7,357 |
| 1997 | 8,418 | 9,514 | 9,913 | 8,597 | 8,770 | 8,750 | 8,229 | 8,401 | 8,433 | 8,821 | 8,520 | 8,551 |
| 1998 | 9,044 | 9,519 | 8,829 | 8,243 | 8,586 | 8,570 | 9,009 | 9,528 | 9,842 | 8,578 | 8,793 | 8,530 |
| 1999 | 9,929 | 10,182 | 8,836 | 9,336 | 9,352 | 9,112 | 8,457 | 8,668 | 9,593 | 8,759 | 8,896 | 7,930 |
| 2000 | 8,827 | 10,324 | 8,734 | 8,721 | 8,602 | 10,346 | 9,591 | 8,530 | 8,669 | 7,646 | 8,406 | 8,145 |
| 2001 | 9,574 | 9,154 | 8,247 | 9,641 | 9,445 | 9,379 | 9,420 | 9,495 | 10,016 | 9,182 | 8,265 | 8,689 |
| 2002 | 8,843 | 9,438 | 8,902 | 8,571 | 8,647 | 9,580 | 9,385 | 8,272 | 9,653 | 8,172 | 8,782 | 7,250 |
| 2003 | 8,441 | 8,325 | 8,713 | 8,271 | 7,190 | 7,661 | 8,193 | 7,705 | 7,436 | 7,625 | 7,509 | 6,971 |
| 2004 | 7,858 | 8,801 | 7,251 | 7,494 | 7,785 | 7,515 | 7,197 | 7,523 | 7,284 | 7,352 | 7,469 | 7,310 |
| 2005 | 8,235 | 9,206 | 8,693 | 8,520 | 8,645 | 7,750 | 8,012 | 7,772 | 7,963 | 8,184 | 7,948 | 7,701 |
| 2006 | 8,689 | 9,046 | 9,497 | 9,337 | 8,618 | 8,421 | 8,382 | 8,087 | 8,745 | 8,326 | 8,251 | 8,495 |
| 2007 | 8,258 | 8,439 | 8,108 | 8,184 | 8,103 | 7,727 | 7,947 | 7,560 | 8,309 | 8,035 | 8,333 | 8,146 |
| 2008 | 9,366 | 9,775 | 9,046 | 8,377 | 7,976 | 8,415 | 7,837 | 8,769 | 9,121 | 8,719 | 8,470 | 7,739 |
| 2009 | 9,561 | 9,755 | 9,584 | 8,926 | 8,194 | 8,833 | 9,722 | 9,467 | 9,675 | 9,160 | 9,520 | 8,862 |
| 2010 | 9,779 | 11,197 | 10,566 | 9,579 | 9,363 | 9,476 | 9,785 | 8,853 | 10,094 | 9,588 | 9,577 | 9,495 |
| 2011 | 10,260 | 10,382 | 9,847 | 9,815 | 9,543 | 8,539 | 9,466 | 9,361 | 9,662 | 9,855 | 9,450 | 9,997 |
| 2012 | 10,578 | 11,025 | 10,673 | 9,323 | 9,203 | 9,365 | 9,935 | 10,310 | 9,847 | 9,056 | 9,901 | 10,289 |
| 2013 | 10,423 | 10,864 | 10,916 | 10,093 | 10,124 | 10,016 | 9,227 | 9,677 | 11,177 | 11,444 | 11,117 | 11,373 |
| 2014 | 12,424 | 13,740 | 12,183 | 11,576 | 10,680 | 11,363 | 11,319 | 11,399 | 12,201 | 11,931 | 12,434 | 12,996 |
| 2015 | 12,992 | 13,159 | 13,850 | 12,260 | 12,268 | 12,077 | 12,129 | 12,353 | 12,290 | 12,561 | 12,535 | 12,895 |
| 2016 | 14,246 | 14,196 | 14,271 | 12,705 | 13,003 | 12,800 | 12,308 | 12,631 | 13,312 | 12,471 | 12,283 | 12,972 |
| 2017 | 14,447 | 15,458 | 15,559 | 14,499 | 13,702 | 12,816 | 13,202 | 12,173 | 12,404 | 12,930 | 12,889 | 13,490 |
| 2018 | 14,696 | 14,940 | 14,840 | 13,857 | 13,035 | 13,084 | 13,420 | 13,036 | 14,054 | 13,397 | 14,285 | 14,756 |
| 2019 | 14,995 | 15,287 | 15,240 | 14,147 | 12,186 | 12,076 | 12,545 | 13,011 | 12,945 | 12,527 | 12,310 | 13,192 |
| 2020 | 13,919 | 14,205 | 13,783 | 11,694 | 12,185 | 11,710 | 11,647 | 11,255 | 11,907 | 12,167 | 11,926 | 12,063 |
| 2021 | 13,161 | 12,494 | 12,442 | 11,905 | 12,067 | 12,969 | 12,503 | 12,161 | 13,603 | 12,499 | 12,595 | 12,936 |
| 2022 | 14,555 | 14,312 | 13,917 | 12,050 | 12,663 | 12,927 | 12,584 | 11,730 | 12,327 | 13,779 | 13,225 | 12,579 |
| 2023 | 14,156 | 13,965 | 13,603 | 12,758 | 12,793 | 12,406 | 13,471 | 12,554 | 13,341 | 12,623 | 13,711 | 14,160 |
| 2024 | 14,787 | |||||||||||
| - = No Data Reported; -- = Not Applicable; NA = Not Available; W = Withheld to avoid disclosure of individual company data. |
| Release Date: 3/29/2024 |
| Next Release Date: 4/30/2024 |