|
Download Data (XLS File) |
|
||||||||
|
||||||||
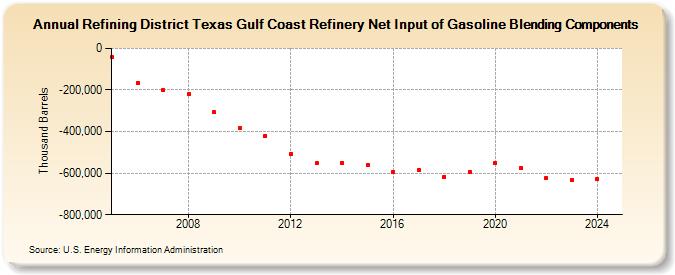
| Refining District Texas Gulf Coast Refinery Net Input of Gasoline Blending Components (Thousand Barrels) | ||||||||
| Decade | Year-0 | Year-1 | Year-2 | Year-3 | Year-4 | Year-5 | Year-6 | Year-7 | Year-8 | Year-9 |
|---|---|---|---|---|---|---|---|---|---|---|
| 2000's | -41,537 | -165,498 | -200,212 | -220,229 | -307,775 | |||||
| 2010's | -385,068 | -420,632 | -505,941 | -552,340 | -549,642 | -560,663 | -593,695 | -585,380 | -617,285 | -592,501 |
| 2020's | -551,827 | -575,255 | -624,389 | -631,393 |
| - = No Data Reported; -- = Not Applicable; NA = Not Available; W = Withheld to avoid disclosure of individual company data. |
| Release Date: 8/30/2024 |
| Next Release Date: 8/29/2025 |