|
Download Data (XLS File) |
|
||||||||
|
||||||||
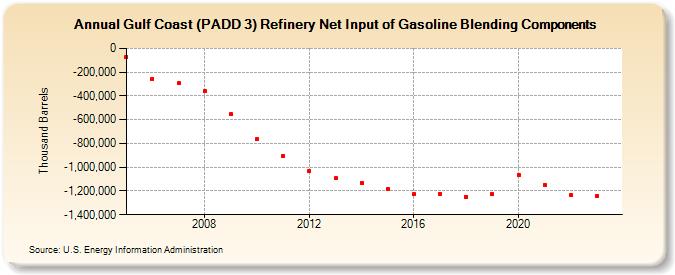
| Gulf Coast (PADD 3) Refinery Net Input of Gasoline Blending Components (Thousand Barrels) | ||||||||
| Decade | Year-0 | Year-1 | Year-2 | Year-3 | Year-4 | Year-5 | Year-6 | Year-7 | Year-8 | Year-9 |
|---|---|---|---|---|---|---|---|---|---|---|
| 2000's | -70,593 | -255,674 | -295,158 | -360,746 | -555,620 | |||||
| 2010's | -763,301 | -907,585 | -1,035,065 | -1,093,112 | -1,132,844 | -1,184,619 | -1,228,665 | -1,222,468 | -1,248,219 | -1,228,454 |
| 2020's | -1,063,883 | -1,147,195 | -1,233,886 | -1,243,825 |
| - = No Data Reported; -- = Not Applicable; NA = Not Available; W = Withheld to avoid disclosure of individual company data. |
| Release Date: 3/29/2024 |
| Next Release Date: 8/30/2024 |