|
Download Data (XLS File) |
|
||||||||
|
||||||||
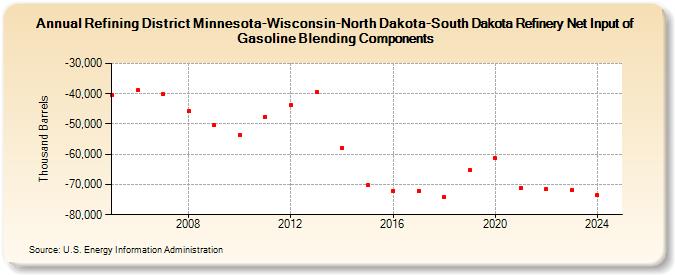
| Refining District Minnesota-Wisconsin-North Dakota-South Dakota Refinery Net Input of Gasoline Blending Components (Thousand Barrels) | ||||||||
| Decade | Year-0 | Year-1 | Year-2 | Year-3 | Year-4 | Year-5 | Year-6 | Year-7 | Year-8 | Year-9 |
|---|---|---|---|---|---|---|---|---|---|---|
| 2000's | -40,257 | -38,918 | -40,091 | -45,801 | -50,344 | |||||
| 2010's | -53,755 | -47,627 | -43,866 | -39,432 | -57,795 | -70,249 | -72,022 | -72,096 | -74,279 | -65,220 |
| 2020's | -61,411 | -71,164 | -71,562 | -71,711 |
| - = No Data Reported; -- = Not Applicable; NA = Not Available; W = Withheld to avoid disclosure of individual company data. |
| Release Date: 3/29/2024 |
| Next Release Date: 8/30/2024 |