|
Download Data (XLS File) |
|
||||||||
|
||||||||
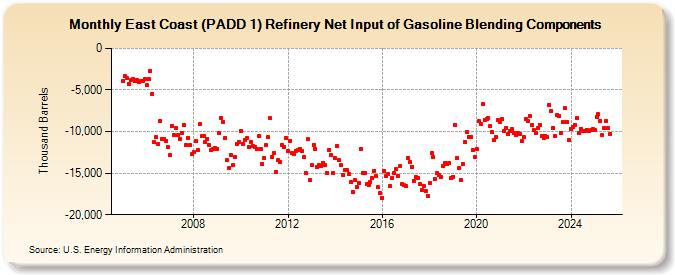
| East Coast (PADD 1) Refinery Net Input of Gasoline Blending Components (Thousand Barrels) | ||||||||
| Year | Jan | Feb | Mar | Apr | May | Jun | Jul | Aug | Sep | Oct | Nov | Dec |
|---|---|---|---|---|---|---|---|---|---|---|---|---|
| 2005 | -3,929 | -3,322 | -3,541 | -4,260 | -3,851 | -3,655 | -3,953 | -3,779 | -4,066 | -3,959 | -3,883 | -3,708 |
| 2006 | -4,454 | -3,654 | -2,713 | -5,441 | -11,294 | -10,715 | -11,452 | -8,759 | -10,890 | -10,929 | -11,093 | -11,916 |
| 2007 | -12,844 | -9,295 | -10,386 | -9,553 | -10,432 | -10,855 | -10,124 | -9,229 | -11,561 | -10,762 | -11,672 | -12,745 |
| 2008 | -12,402 | -11,119 | -12,231 | -9,120 | -10,568 | -10,525 | -11,271 | -10,871 | -11,652 | -12,222 | -12,143 | -11,983 |
| 2009 | -12,092 | -10,209 | -8,362 | -8,813 | -10,781 | -13,468 | -14,395 | -12,797 | -14,023 | -13,050 | -11,475 | -11,284 |
| 2010 | -9,882 | -11,503 | -10,971 | -10,816 | -11,881 | -11,232 | -11,723 | -11,878 | -12,145 | -10,567 | -12,082 | -13,864 |
| 2011 | -13,224 | -11,662 | -10,674 | -8,426 | -13,017 | -12,551 | -14,838 | -13,427 | -13,605 | -11,674 | -11,837 | -10,763 |
| 2012 | -12,330 | -11,132 | -12,590 | -12,724 | -12,328 | -12,203 | -12,076 | -12,344 | -13,035 | -14,947 | -10,950 | -15,846 |
| 2013 | -14,080 | -11,568 | -12,120 | -14,275 | -14,061 | -14,091 | -13,722 | -14,065 | -14,972 | -12,163 | -12,837 | -14,978 |
| 2014 | -13,142 | -11,695 | -13,426 | -14,060 | -15,180 | -14,626 | -14,661 | -15,104 | -16,054 | -17,210 | -15,809 | -16,706 |
| 2015 | -16,152 | -12,125 | -14,960 | -14,944 | -16,363 | -16,383 | -16,013 | -15,615 | -14,721 | -15,397 | -16,716 | -17,346 |
| 2016 | -17,942 | -14,705 | -15,325 | -15,088 | -16,507 | -15,534 | -14,978 | -14,551 | -15,331 | -14,184 | -16,349 | -16,457 |
| 2017 | -16,584 | -13,195 | -13,712 | -14,226 | -15,913 | -15,472 | -15,568 | -16,341 | -17,055 | -16,494 | -17,123 | -17,770 |
| 2018 | -16,169 | -12,574 | -13,053 | -15,718 | -15,003 | -15,233 | -15,486 | -14,134 | -13,769 | -13,874 | -13,798 | -15,641 |
| 2019 | -15,417 | -9,201 | -13,155 | -14,430 | -15,860 | -13,945 | -11,250 | -10,110 | -10,625 | -10,620 | -12,208 | -13,009 |
| 2020 | -12,092 | -8,779 | -9,048 | -6,730 | -8,625 | -8,463 | -8,366 | -9,344 | -10,025 | -10,956 | -10,692 | -8,604 |
| 2021 | -8,800 | -8,471 | -9,889 | -9,536 | -10,321 | -9,959 | -9,707 | -10,201 | -10,453 | -10,226 | -10,341 | -11,192 |
| 2022 | -10,697 | -8,513 | -8,687 | -8,134 | -9,270 | -9,852 | -10,146 | -9,618 | -9,241 | -10,483 | -10,767 | -10,541 |
| 2023 | -10,708 | -6,818 | -7,502 | -9,570 | -10,538 | -8,003 | -8,115 | -10,173 | -8,846 | -7,211 | -8,815 | -11,075 |
| 2024 | -9,661 | -9,403 | -9,228 | -8,393 | ||||||||
| - = No Data Reported; -- = Not Applicable; NA = Not Available; W = Withheld to avoid disclosure of individual company data. |
| Release Date: 6/28/2024 |
| Next Release Date: 7/31/2024 |