|
Download Data (XLS File) |
|
||||||||
|
||||||||
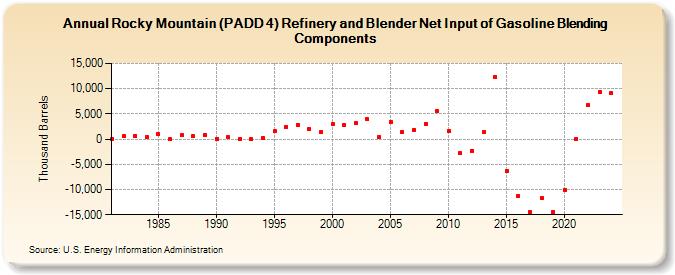
| Rocky Mountain (PADD 4) Refinery and Blender Net Input of Gasoline Blending Components (Thousand Barrels) | ||||||||
| Decade | Year-0 | Year-1 | Year-2 | Year-3 | Year-4 | Year-5 | Year-6 | Year-7 | Year-8 | Year-9 |
|---|---|---|---|---|---|---|---|---|---|---|
| 1980's | 5 | 545 | 704 | 448 | 991 | -48 | 767 | 562 | 856 | |
| 1990's | 21 | 458 | -63 | 35 | 236 | 1,536 | 2,411 | 2,844 | 1,971 | 1,363 |
| 2000's | 2,928 | 2,862 | 3,158 | 3,898 | 391 | 3,432 | 1,374 | 1,858 | 3,031 | 5,521 |
| 2010's | 1,544 | -2,818 | -2,275 | 1,357 | 12,351 | -6,236 | -11,256 | -14,498 | -11,606 | -14,522 |
| 2020's | -10,066 | 77 | 6,799 | 9,348 |
| - = No Data Reported; -- = Not Applicable; NA = Not Available; W = Withheld to avoid disclosure of individual company data. |
| Release Date: 8/30/2024 |
| Next Release Date: 8/29/2025 |