|
Download Data (XLS File) |
|
||||||||
|
||||||||
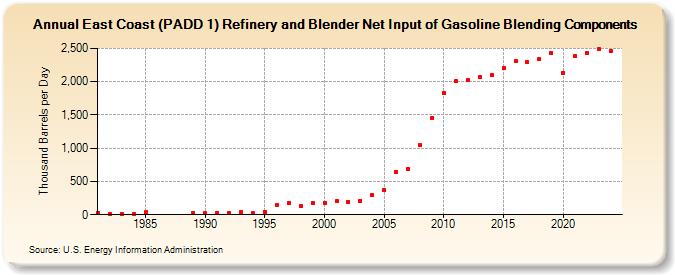
| East Coast (PADD 1) Refinery and Blender Net Input of Gasoline Blending Components (Thousand Barrels per Day) | ||||||||
| Decade | Year-0 | Year-1 | Year-2 | Year-3 | Year-4 | Year-5 | Year-6 | Year-7 | Year-8 | Year-9 |
|---|---|---|---|---|---|---|---|---|---|---|
| 1980's | 32 | 14 | 15 | 16 | 36 | 27 | ||||
| 1990's | 26 | 28 | 30 | 41 | 25 | 42 | 142 | 175 | 127 | 173 |
| 2000's | 176 | 204 | 198 | 213 | 294 | 374 | 639 | 689 | 1,050 | 1,457 |
| 2010's | 1,834 | 2,005 | 2,024 | 2,072 | 2,100 | 2,198 | 2,305 | 2,295 | 2,338 | 2,438 |
| 2020's | 2,136 | 2,387 | 2,438 | 2,483 |
| - = No Data Reported; -- = Not Applicable; NA = Not Available; W = Withheld to avoid disclosure of individual company data. |
| Release Date: 3/29/2024 |
| Next Release Date: 8/30/2024 |