|
Download Data (XLS File) |
|
||||||||
|
||||||||
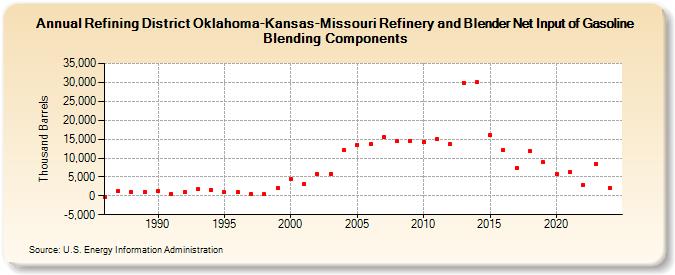
| Refining District Oklahoma-Kansas-Missouri Refinery and Blender Net Input of Gasoline Blending Components (Thousand Barrels) | ||||||||
| Decade | Year-0 | Year-1 | Year-2 | Year-3 | Year-4 | Year-5 | Year-6 | Year-7 | Year-8 | Year-9 |
|---|---|---|---|---|---|---|---|---|---|---|
| 1980's | -192 | 1,253 | 942 | 1,057 | ||||||
| 1990's | 1,212 | 543 | 970 | 1,678 | 1,537 | 947 | 902 | 464 | 402 | 2,152 |
| 2000's | 4,324 | 3,223 | 5,686 | 5,873 | 11,994 | 13,452 | 13,583 | 15,460 | 14,450 | 14,570 |
| 2010's | 14,174 | 14,910 | 13,683 | 29,944 | 30,034 | 16,000 | 12,185 | 7,363 | 11,721 | 8,848 |
| 2020's | 5,802 | 6,283 | 2,921 | 8,397 |
| - = No Data Reported; -- = Not Applicable; NA = Not Available; W = Withheld to avoid disclosure of individual company data. |
| Release Date: 3/29/2024 |
| Next Release Date: 8/30/2024 |