|
Download Data (XLS File) |
|
||||||||
|
||||||||
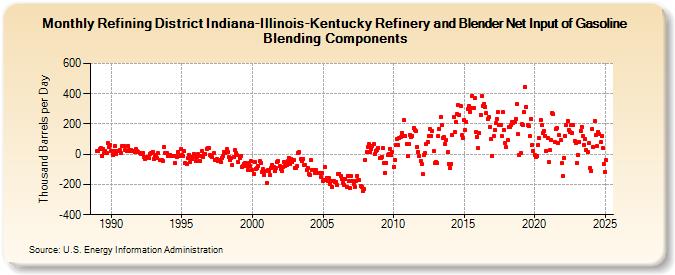
| Refining District Indiana-Illinois-Kentucky Refinery and Blender Net Input of Gasoline Blending Components (Thousand Barrels per Day) | ||||||||
| Year | Jan | Feb | Mar | Apr | May | Jun | Jul | Aug | Sep | Oct | Nov | Dec |
|---|---|---|---|---|---|---|---|---|---|---|---|---|
| 1989 | 18 | 24 | 34 | 38 | -12 | 35 | 9 | 22 | 7 | 73 | 47 | 64 |
| 1990 | 24 | -3 | 18 | 53 | 4 | 22 | 19 | 31 | 5 | 53 | 56 | 56 |
| 1991 | 26 | 22 | 56 | 25 | 23 | 29 | 21 | 22 | 14 | 32 | 20 | 17 |
| 1992 | 10 | 0 | 11 | 7 | -21 | -33 | -20 | -20 | -27 | 3 | 5 | 16 |
| 1993 | -29 | -10 | -7 | -25 | 5 | -40 | -39 | -36 | -44 | 51 | 7 | 8 |
| 1994 | -11 | -14 | -4 | -10 | -15 | -10 | -58 | -12 | -19 | 13 | -12 | 34 |
| 1995 | -5 | -14 | 18 | -59 | -62 | -25 | -8 | -52 | -21 | -34 | 4 | -18 |
| 1996 | -48 | -16 | -1 | -42 | -14 | 20 | -21 | 4 | 2 | 37 | 38 | 38 |
| 1997 | -4 | -9 | -20 | 6 | -41 | -38 | -34 | -42 | -37 | -54 | -23 | -11 |
| 1998 | 13 | 9 | 32 | 13 | -21 | -40 | -27 | -71 | -20 | 28 | 9 | -7 |
| 1999 | -53 | -25 | -14 | -86 | -79 | -62 | -56 | -78 | -107 | -56 | -80 | -48 |
| 2000 | -105 | -128 | -49 | -97 | -93 | -79 | -47 | -57 | -116 | -101 | -135 | -108 |
| 2001 | -190 | -102 | -108 | -139 | -94 | -71 | -87 | -111 | -92 | -49 | -45 | -80 |
| 2002 | -100 | -109 | -83 | -49 | -77 | -71 | -47 | -23 | -62 | -31 | -54 | -39 |
| 2003 | -91 | -88 | -80 | 11 | 12 | -33 | -44 | -29 | -68 | -73 | -105 | -93 |
| 2004 | -131 | -139 | -39 | -103 | -107 | -121 | -104 | -127 | -125 | -127 | -149 | -121 |
| 2005 | -175 | -170 | -87 | -155 | -178 | -160 | -195 | -174 | -216 | -177 | -182 | -183 |
| 2006 | -203 | -130 | -128 | -141 | -165 | -187 | -203 | -161 | -214 | -142 | -176 | -225 |
| 2007 | -146 | -177 | -195 | -218 | -175 | -142 | -168 | -173 | -208 | -219 | -241 | -232 |
| 2008 | -39 | 15 | 51 | 66 | 14 | 34 | 56 | 66 | -1 | 23 | 30 | 43 |
| 2009 | -26 | -27 | -16 | 41 | -57 | -121 | -56 | -6 | 3 | 33 | -4 | 16 |
| 2010 | -82 | -39 | 59 | 101 | 61 | 104 | 112 | 143 | 122 | 224 | 120 | 70 |
| 2011 | -11 | 69 | 129 | 111 | 120 | 175 | 161 | 154 | 48 | 17 | -10 | -45 |
| 2012 | -66 | -131 | -2 | 8 | 68 | 84 | 122 | 167 | 121 | 155 | 19 | -59 |
| 2013 | -51 | -60 | 118 | 170 | 244 | 191 | 110 | 113 | 66 | 93 | 12 | -62 |
| 2014 | -92 | -62 | 127 | 246 | 148 | 212 | 263 | 323 | 262 | 322 | 125 | 107 |
| 2015 | 226 | 158 | 213 | 298 | 322 | 281 | 308 | 388 | 307 | 371 | 148 | 117 |
| 2016 | 39 | 140 | 260 | 386 | 322 | 335 | 315 | 271 | 234 | 246 | 181 | 100 |
| 2017 | -11 | 118 | 160 | 208 | 235 | 277 | 194 | 191 | 120 | 276 | 159 | 75 |
| 2018 | 45 | 93 | 177 | 183 | 191 | 213 | 207 | 214 | 232 | 332 | 132 | -6 |
| 2019 | 7 | 198 | 191 | 279 | 444 | 313 | 195 | 184 | 122 | 230 | 62 | 22 |
| 2020 | -4 | -19 | -13 | 59 | 104 | 225 | 190 | 143 | 155 | 122 | 22 | 110 |
| 2021 | -54 | 25 | 93 | 275 | 264 | 81 | 169 | 172 | 73 | 125 | 94 | -59 |
| 2022 | -145 | -24 | 122 | 192 | 221 | 159 | 148 | 191 | 140 | 194 | 88 | 71 |
| 2023 | -55 | -6 | 83 | 156 | 181 | 122 | 64 | 99 | 28 | 13 | 72 | -90 |
| 2024 | -109 | |||||||||||
| - = No Data Reported; -- = Not Applicable; NA = Not Available; W = Withheld to avoid disclosure of individual company data. |
| Release Date: 3/29/2024 |
| Next Release Date: 4/30/2024 |