|
Download Data (XLS File) |
|
||||||||
|
||||||||
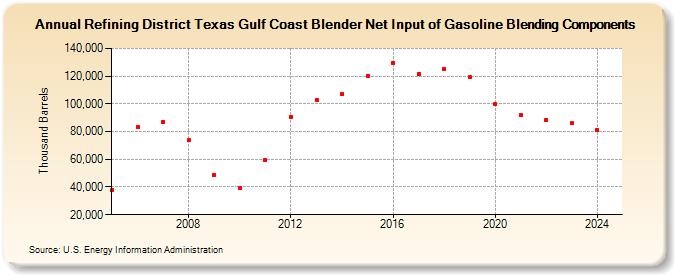
| Refining District Texas Gulf Coast Blender Net Input of Gasoline Blending Components (Thousand Barrels) | ||||||||
| Decade | Year-0 | Year-1 | Year-2 | Year-3 | Year-4 | Year-5 | Year-6 | Year-7 | Year-8 | Year-9 |
|---|---|---|---|---|---|---|---|---|---|---|
| 2000's | 38,101 | 83,510 | 87,070 | 73,654 | 48,496 | |||||
| 2010's | 39,465 | 59,581 | 90,784 | 102,969 | 107,130 | 120,397 | 129,703 | 121,804 | 125,246 | 119,458 |
| 2020's | 100,026 | 91,850 | 88,341 | 85,872 |
| - = No Data Reported; -- = Not Applicable; NA = Not Available; W = Withheld to avoid disclosure of individual company data. |
| Release Date: 3/29/2024 |
| Next Release Date: 8/30/2024 |