|
Download Data (XLS File) |
|
||||||||
|
||||||||
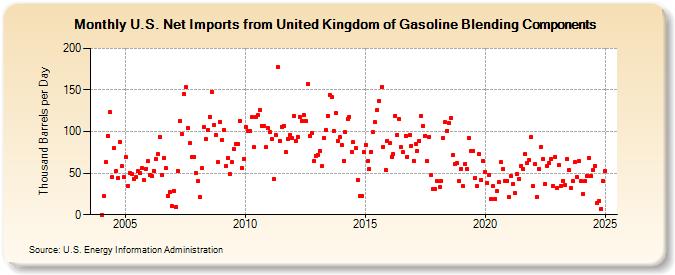
| U.S. Net Imports from United Kingdom of Gasoline Blending Components (Thousand Barrels per Day) | ||||||||
| Year | Jan | Feb | Mar | Apr | May | Jun | Jul | Aug | Sep | Oct | Nov | Dec |
|---|---|---|---|---|---|---|---|---|---|---|---|---|
| 2004 | 0 | 22 | 63 | 95 | 123 | 45 | 80 | 52 | 44 | 88 | 58 | 45 |
| 2005 | 69 | 35 | 50 | 49 | 43 | 45 | 52 | 50 | 56 | 42 | 55 | 64 |
| 2006 | 48 | 46 | 53 | 67 | 73 | 94 | 48 | 68 | 56 | 23 | 27 | 10 |
| 2007 | 29 | 9 | 53 | 113 | 97 | 145 | 153 | 104 | 86 | 69 | 70 | 50 |
| 2008 | 40 | 21 | 56 | 105 | 91 | 102 | 118 | 148 | 108 | 96 | 63 | 112 |
| 2009 | 90 | 102 | 58 | 68 | 49 | 63 | 79 | 85 | 85 | 113 | 56 | 67 |
| 2010 | 106 | 101 | 101 | 117 | 81 | 118 | 120 | 126 | 107 | 107 | 81 | 104 |
| 2011 | 99 | 91 | 43 | 96 | 178 | 89 | 106 | 107 | 75 | 91 | 96 | 92 |
| 2012 | 119 | 89 | 94 | 118 | 113 | 120 | 113 | 157 | 95 | 98 | 64 | 71 |
| 2013 | 72 | 77 | 58 | 92 | 102 | 119 | 144 | 141 | 101 | 122 | 89 | 93 |
| 2014 | 84 | 65 | 99 | 115 | 118 | 76 | 87 | 80 | 42 | 22 | 23 | 75 |
| 2015 | 84 | 64 | 55 | 76 | 99 | 111 | 126 | 137 | 154 | 82 | 54 | 89 |
| 2016 | 86 | 70 | 73 | 119 | 96 | 115 | 81 | 75 | 95 | 70 | 96 | 83 |
| 2017 | 65 | 85 | 77 | 89 | 119 | 107 | 95 | 64 | 94 | 48 | 31 | 31 |
| 2018 | 40 | 33 | 40 | 92 | 111 | 101 | 110 | 116 | 72 | 61 | 62 | 40 |
| 2019 | 55 | 34 | 61 | 55 | 92 | 77 | 77 | 44 | 34 | 73 | 42 | 64 |
| 2020 | 51 | 38 | 48 | 19 | 34 | 19 | 28 | 39 | 63 | 55 | 40 | 41 |
| 2021 | 21 | 46 | 37 | 26 | 49 | 43 | 59 | 55 | 73 | 62 | 66 | 93 |
| 2022 | 34 | 61 | 21 | 55 | 82 | 67 | 37 | 58 | 62 | 67 | 35 | 70 |
| 2023 | 32 | 60 | 35 | 41 | 36 | 67 | 54 | 32 | 40 | 63 | 45 | 64 |
| 2024 | 40 | |||||||||||
| - = No Data Reported; -- = Not Applicable; NA = Not Available; W = Withheld to avoid disclosure of individual company data. |
| Release Date: 3/29/2024 |
| Next Release Date: 4/30/2024 |