|
Download Data (XLS File) |
|
||||||||
|
||||||||
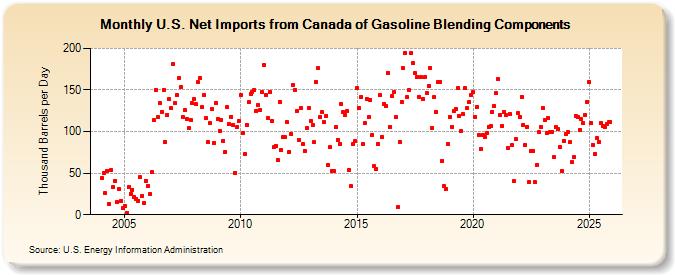
| U.S. Net Imports from Canada of Gasoline Blending Components (Thousand Barrels per Day) | ||||||||
| Year | Jan | Feb | Mar | Apr | May | Jun | Jul | Aug | Sep | Oct | Nov | Dec |
|---|---|---|---|---|---|---|---|---|---|---|---|---|
| 2004 | 44 | 50 | 26 | 53 | 13 | 54 | 33 | 41 | 15 | 31 | 17 | 8 |
| 2005 | 11 | 2 | 33 | 25 | 30 | 21 | 19 | 17 | 45 | 23 | 14 | 41 |
| 2006 | 35 | 25 | 51 | 114 | 150 | 117 | 134 | 124 | 150 | 88 | 120 | 139 |
| 2007 | 128 | 181 | 134 | 144 | 164 | 153 | 117 | 126 | 115 | 104 | 114 | 134 |
| 2008 | 139 | 133 | 159 | 164 | 129 | 144 | 116 | 87 | 110 | 127 | 86 | 134 |
| 2009 | 115 | 101 | 114 | 89 | 76 | 129 | 109 | 118 | 108 | 50 | 105 | 113 |
| 2010 | 144 | 98 | 73 | 108 | 135 | 145 | 148 | 150 | 125 | 132 | 126 | 147 |
| 2011 | 180 | 144 | 116 | 148 | 113 | 81 | 83 | 66 | 136 | 78 | 94 | 93 |
| 2012 | 111 | 76 | 97 | 156 | 150 | 125 | 90 | 128 | 85 | 77 | 104 | 128 |
| 2013 | 113 | 108 | 87 | 160 | 176 | 118 | 123 | 111 | 119 | 60 | 81 | 53 |
| 2014 | 52 | 105 | 90 | 85 | 133 | 123 | 120 | 125 | 54 | 34 | 85 | 89 |
| 2015 | 152 | 128 | 141 | 85 | 110 | 139 | 117 | 138 | 96 | 58 | 55 | 85 |
| 2016 | 144 | 94 | 133 | 131 | 171 | 106 | 143 | 147 | 117 | 9 | 88 | 136 |
| 2017 | 176 | 195 | 141 | 150 | 194 | 182 | 170 | 166 | 142 | 165 | 139 | 165 |
| 2018 | 146 | 155 | 177 | 104 | 141 | 124 | 159 | 160 | 65 | 34 | 31 | 85 |
| 2019 | 118 | 106 | 125 | 127 | 152 | 119 | 101 | 121 | 152 | 128 | 136 | 144 |
| 2020 | 147 | 118 | 130 | 96 | 79 | 96 | 94 | 98 | 106 | 107 | 124 | 131 |
| 2021 | 146 | 163 | 120 | 107 | 123 | 120 | 80 | 121 | 84 | 40 | 91 | 122 |
| 2022 | 118 | 142 | 108 | 84 | 106 | 39 | 77 | 77 | 39 | 60 | 99 | 106 |
| 2023 | 127 | 114 | 98 | 116 | 99 | 100 | 69 | 105 | 103 | 81 | 52 | 88 |
| 2024 | 97 | |||||||||||
| - = No Data Reported; -- = Not Applicable; NA = Not Available; W = Withheld to avoid disclosure of individual company data. |
| Release Date: 3/29/2024 |
| Next Release Date: 4/30/2024 |