|
Download Data (XLS File) |
|
||||||||
|
||||||||
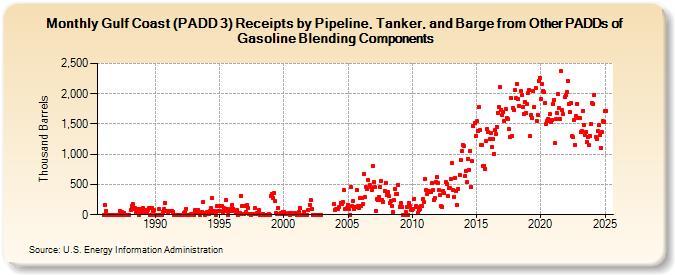
| Gulf Coast (PADD 3) Receipts by Pipeline, Tanker, and Barge from Other PADDs of Gasoline Blending Components (Thousand Barrels) | ||||||||
| Year | Jan | Feb | Mar | Apr | May | Jun | Jul | Aug | Sep | Oct | Nov | Dec |
|---|---|---|---|---|---|---|---|---|---|---|---|---|
| 1986 | 0 | 157 | 60 | 0 | 0 | 0 | 0 | 0 | 0 | 0 | 0 | 0 |
| 1987 | 0 | 0 | 0 | 67 | 0 | 42 | 0 | 21 | 0 | 0 | 0 | 0 |
| 1988 | 0 | 80 | 150 | 176 | 102 | 108 | 48 | 95 | 94 | 0 | 47 | 102 |
| 1989 | 55 | 109 | 36 | 76 | 40 | 84 | 107 | 0 | 0 | 110 | 55 | 75 |
| 1990 | 0 | 0 | 0 | 0 | 95 | 0 | 0 | 47 | 100 | 192 | 54 | 56 |
| 1991 | 52 | 56 | 55 | 55 | 55 | 46 | 0 | 0 | 0 | 0 | 0 | 0 |
| 1992 | 0 | 0 | 0 | 22 | 51 | 101 | 0 | 0 | 0 | 10 | 10 | 10 |
| 1993 | 0 | 70 | 56 | 52 | 76 | 33 | 0 | 30 | 49 | 214 | 0 | 31 |
| 1994 | 39 | 40 | 10 | 62 | 113 | 279 | 29 | 66 | 46 | 0 | 148 | 60 |
| 1995 | 61 | 150 | 142 | 47 | 110 | 69 | 240 | 98 | 0 | 67 | 65 | 93 |
| 1996 | 158 | 101 | 69 | 51 | 76 | 0 | 9 | 36 | 317 | 138 | 9 | 9 |
| 1997 | 152 | 49 | 167 | 115 | 9 | 0 | 20 | 20 | 10 | 108 | 17 | 30 |
| 1998 | 32 | 73 | 0 | 2 | 18 | 9 | 3 | 1 | 0 | 0 | 9 | 0 |
| 1999 | 311 | 344 | 284 | 360 | 221 | 29 | 19 | 117 | 9 | 30 | 4 | 47 |
| 2000 | 38 | 30 | 19 | 20 | 19 | 28 | 0 | 28 | 19 | 9 | 29 | 12 |
| 2001 | 0 | 0 | 51 | 103 | 0 | 0 | 0 | 50 | 0 | 0 | 0 | 83 |
| 2002 | 165 | 240 | 100 | 0 | 0 | 0 | 0 | 0 | 0 | 0 | 0 | 0 |
| 2003 | 174 | |||||||||||
| 2004 | 84 | 89 | 90 | 91 | 132 | 191 | 173 | 218 | 406 | 88 | 115 | |
| 2005 | 165 | 94 | 0 | 453 | 136 | 220 | 96 | 132 | 416 | 137 | 111 | 275 |
| 2006 | 152 | 281 | 174 | 679 | 298 | 453 | 425 | 577 | 484 | 464 | 411 | 798 |
| 2007 | 538 | 452 | 56 | 258 | 235 | 301 | 451 | 555 | 241 | 218 | 397 | 530 |
| 2008 | 326 | 372 | 317 | 198 | 232 | 141 | 48 | 244 | 421 | 339 | 344 | 499 |
| 2009 | 135 | 186 | 135 | 0 | 0 | 0 | 45 | 124 | 0 | 188 | 139 | 84 |
| 2010 | 77 | 101 | 265 | 142 | 135 | 25 | 80 | 101 | 137 | 139 | 252 | 210 |
| 2011 | 588 | 403 | 336 | 378 | 386 | 379 | 521 | 401 | 250 | 284 | 546 | 616 |
| 2012 | 527 | 404 | 329 | 142 | 132 | 389 | 355 | 536 | 500 | 314 | 448 | 437 |
| 2013 | 595 | 853 | 416 | 301 | 610 | 386 | 155 | 431 | 663 | 907 | 1,053 | 1,159 |
| 2014 | 1,143 | 637 | 726 | 543 | 929 | 741 | 1,057 | 459 | 886 | 1,461 | 1,519 | 1,306 |
| 2015 | 1,543 | 1,392 | 1,775 | 1,398 | 1,147 | 1,159 | 800 | 811 | 761 | 1,213 | 1,415 | 1,360 |
| 2016 | 1,245 | 1,348 | 1,122 | 1,257 | 1,010 | 1,396 | 1,342 | 1,449 | 1,688 | 1,775 | 2,105 | 1,730 |
| 2017 | 1,645 | 1,690 | 1,543 | 1,742 | 1,601 | 1,586 | 1,419 | 1,288 | 1,937 | 1,305 | 1,764 | 1,735 |
| 2018 | 2,059 | 1,924 | 2,165 | 1,907 | 1,801 | 2,039 | 1,973 | 1,773 | 1,667 | 1,868 | 1,683 | 1,829 |
| 2019 | 2,011 | 2,062 | 1,298 | 1,647 | 1,595 | 2,037 | 1,778 | 2,093 | 1,556 | 1,655 | 2,214 | 2,263 |
| 2020 | 1,916 | 2,164 | 2,048 | 2,024 | 1,848 | 1,503 | 1,551 | 1,589 | 1,667 | 1,529 | 1,570 | 1,830 |
| 2021 | 1,894 | 1,179 | 1,577 | 1,686 | 1,996 | 1,768 | 1,588 | 2,372 | 1,727 | 1,659 | 1,943 | 1,974 |
| 2022 | 2,030 | 2,208 | 1,834 | 1,697 | 1,847 | 1,299 | 1,278 | 1,565 | 1,153 | 1,628 | 1,838 | 1,597 |
| 2023 | 1,607 | 1,363 | 1,384 | 1,722 | 1,490 | 1,316 | 1,364 | 1,202 | 1,278 | 1,147 | 1,302 | 1,507 |
| 2024 | 1,840 | |||||||||||
| - = No Data Reported; -- = Not Applicable; NA = Not Available; W = Withheld to avoid disclosure of individual company data. |
| Release Date: 3/29/2024 |
| Next Release Date: 4/30/2024 |
Referring Pages: