|
Download Data (XLS File) |
|
||||||||
|
||||||||
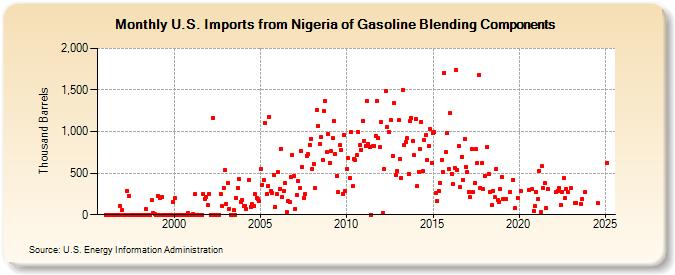
| U.S. Imports from Nigeria of Gasoline Blending Components (Thousand Barrels) | ||||||||
| Year | Jan | Feb | Mar | Apr | May | Jun | Jul | Aug | Sep | Oct | Nov | Dec |
|---|---|---|---|---|---|---|---|---|---|---|---|---|
| 1996 | 0 | 0 | 0 | 0 | 0 | 0 | 0 | 0 | 0 | 0 | 110 | 53 |
| 1997 | 0 | 0 | 0 | 288 | 227 | 0 | 0 | 0 | 0 | 0 | 0 | 0 |
| 1998 | 0 | 0 | 0 | 0 | 71 | 0 | 0 | 0 | 171 | 16 | 7 | 0 |
| 1999 | 231 | 0 | 195 | 211 | 0 | 0 | 0 | 0 | 0 | 0 | 0 | 151 |
| 2000 | 202 | 0 | 0 | 0 | 0 | 0 | 0 | 0 | 0 | 15 | 0 | 0 |
| 2001 | 0 | 4 | 246 | 2 | 0 | 0 | 0 | 0 | 250 | 194 | 218 | 115 |
| 2002 | 251 | 0 | 0 | 1,164 | 0 | 0 | 0 | 0 | 250 | 99 | 324 | 543 |
| 2003 | 134 | 380 | 72 | 0 | 0 | 53 | 0 | 198 | 320 | 427 | 156 | 180 |
| 2004 | 109 | 110 | 65 | 420 | 96 | 127 | 106 | 249 | 199 | 186 | 160 | |
| 2005 | 544 | 361 | 413 | 1,102 | 248 | 350 | 1,181 | 288 | 264 | 479 | 93 | 247 |
| 2006 | 509 | 309 | 795 | 218 | 286 | 376 | 31 | 165 | 150 | 449 | 723 | 468 |
| 2007 | 74 | 236 | 404 | 320 | 764 | 572 | 198 | 252 | 708 | 726 | 843 | 915 |
| 2008 | 552 | 612 | 318 | 1,263 | 1,071 | 848 | 937 | 662 | 1,243 | 1,368 | 749 | 970 |
| 2009 | 625 | 763 | 917 | 1,126 | 728 | 471 | 271 | 834 | 775 | 255 | 963 | 280 |
| 2010 | 545 | 676 | 441 | 997 | 345 | 672 | 660 | 714 | 992 | 837 | 783 | 1,127 |
| 2011 | 892 | 824 | 1,362 | 853 | 809 | 1 | 821 | 831 | 952 | 1,366 | 921 | 810 |
| 2012 | 1,115 | 25 | 548 | 1,490 | 1,055 | 997 | 1,137 | 712 | 1,343 | 474 | 524 | |
| 2013 | 1,135 | 668 | 441 | 1,504 | 835 | 870 | 917 | 490 | 1,130 | 1,162 | 884 | 713 |
| 2014 | 1,145 | 342 | 518 | 793 | 1,119 | 520 | 896 | 954 | 663 | 828 | 1,026 | 626 |
| 2015 | 983 | 992 | 264 | 168 | 280 | 387 | 662 | 512 | 1,709 | 754 | 984 | 545 |
| 2016 | 1,221 | 493 | 365 | 563 | 1,740 | 538 | 831 | 329 | 700 | 422 | 906 | 579 |
| 2017 | 515 | 279 | 209 | 786 | 279 | 380 | 789 | 624 | 1,680 | 322 | 624 | 308 |
| 2018 | 470 | 818 | 492 | 277 | 113 | 283 | 210 | 553 | 176 | 156 | 307 | |
| 2019 | 457 | 189 | 194 | 279 | 423 | 75 | 205 | |||||
| 2020 | 286 | 293 | 307 | 40 | 100 | |||||||
| 2021 | 279 | 188 | 531 | 29 | 582 | 316 | 381 | 80 | 306 | |||
| 2022 | 278 | 289 | 318 | 118 | 279 | 438 | 203 | 308 | 268 | |||
| 2023 | 316 | 139 | 145 | 125 | 186 | 275 | ||||||
| - = No Data Reported; -- = Not Applicable; NA = Not Available; W = Withheld to avoid disclosure of individual company data. |
| Release Date: 3/29/2024 |
| Next Release Date: 4/30/2024 |