|
Download Data (XLS File) |
|
||||||||
|
||||||||
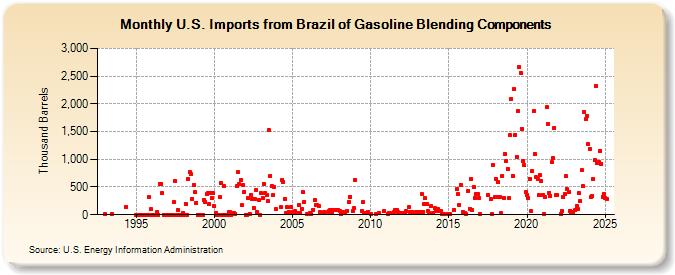
| U.S. Imports from Brazil of Gasoline Blending Components (Thousand Barrels) | ||||||||
| Year | Jan | Feb | Mar | Apr | May | Jun | Jul | Aug | Sep | Oct | Nov | Dec |
|---|---|---|---|---|---|---|---|---|---|---|---|---|
| 1993 | 4 | 19 | ||||||||||
| 1994 | 145 | |||||||||||
| 1995 | 0 | 0 | 0 | 0 | 0 | 0 | 0 | 0 | 0 | 0 | 315 | 97 |
| 1996 | 0 | 0 | 0 | 0 | 48 | 0 | 556 | 559 | 386 | 0 | 0 | 0 |
| 1997 | 0 | 0 | 0 | 0 | 0 | 231 | 605 | 0 | 81 | 0 | 0 | 0 |
| 1998 | 36 | 0 | 199 | 0 | 650 | 768 | 733 | 287 | 541 | 406 | 214 | 0 |
| 1999 | 0 | 0 | 0 | 0 | 273 | 233 | 367 | 383 | 189 | 400 | 306 | 383 |
| 2000 | 151 | 38 | 0 | 0 | 313 | 576 | 0 | 518 | 0 | 0 | 0 | 43 |
| 2001 | 43 | 0 | 39 | 38 | 21 | 516 | 763 | 547 | 618 | 170 | 543 | 416 |
| 2002 | 0 | 0 | 293 | 21 | 362 | 285 | 127 | 280 | 446 | 40 | 262 | 0 |
| 2003 | 385 | 304 | 563 | 396 | 364 | 248 | 1,520 | 703 | 517 | 355 | 501 | 99 |
| 2004 | 139 | 635 | 587 | 287 | 27 | 137 | 50 | 134 | ||||
| 2005 | 53 | 58 | 32 | 33 | 173 | 29 | 112 | 409 | 230 | 11 | ||
| 2006 | 24 | 7 | 93 | 260 | 175 | 175 | 161 | 50 | 30 | |||
| 2007 | 48 | 30 | 49 | 71 | 81 | 47 | 80 | 85 | 93 | 93 | ||
| 2008 | 72 | 15 | 51 | 22 | 71 | 228 | 326 | 58 | 114 | |||
| 2009 | 633 | 72 | 221 | 38 | 22 | 46 | ||||||
| 2010 | 21 | 17 | 29 | 67 | ||||||||
| 2011 | 21 | 34 | 29 | 44 | 83 | 82 | 52 | 23 | ||||
| 2012 | 39 | 36 | 35 | 63 | 133 | 52 | 43 | 38 | 55 | |||
| 2013 | 43 | 37 | 42 | 365 | 57 | 190 | 295 | 197 | 66 | 33 | 154 | |
| 2014 | 23 | 114 | 59 | 70 | 98 | 58 | 58 | 19 | 15 | 19 | ||
| 2015 | 5 | 94 | 457 | 376 | 179 | 543 | 41 | |||||
| 2016 | 23 | 18 | 433 | 109 | 646 | 86 | 503 | 309 | 378 | 380 | 301 | |
| 2017 | 14 | 364 | 286 | 16 | 898 | 311 | ||||||
| 2018 | 653 | 311 | 585 | 313 | 25 | 704 | 305 | 1,096 | 964 | 825 | 299 | 1,432 |
| 2019 | 2,091 | 705 | 2,267 | 1,441 | 1,046 | 1,869 | 2,671 | 2,562 | 1,553 | 973 | 901 | 409 |
| 2020 | 360 | 310 | 651 | 59 | 785 | 1,867 | 1,093 | 676 | 651 | 349 | 717 | 606 |
| 2021 | 353 | 14 | 318 | 1,941 | 1,628 | 398 | 340 | 946 | 1,020 | 1,570 | 351 | 357 |
| 2022 | 15 | 64 | 313 | 378 | 692 | 455 | 402 | 76 | 42 | 45 | ||
| 2023 | 78 | 157 | 112 | 383 | 244 | 801 | 511 | 1,850 | 1,725 | 1,784 | 1,270 | |
| 2024 | 1,191 | |||||||||||
| - = No Data Reported; -- = Not Applicable; NA = Not Available; W = Withheld to avoid disclosure of individual company data. |
| Release Date: 3/29/2024 |
| Next Release Date: 4/30/2024 |