|
Download Data (XLS File) |
|
||||||||
|
||||||||
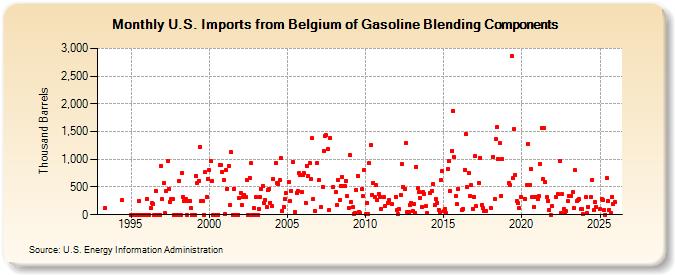
| U.S. Imports from Belgium of Gasoline Blending Components (Thousand Barrels) | ||||||||
| Year | Jan | Feb | Mar | Apr | May | Jun | Jul | Aug | Sep | Oct | Nov | Dec |
|---|---|---|---|---|---|---|---|---|---|---|---|---|
| 1993 | 123 | |||||||||||
| 1994 | 260 | |||||||||||
| 1995 | 0 | 0 | 0 | 0 | 0 | 0 | 248 | 0 | 0 | 0 | 0 | 0 |
| 1996 | 284 | 0 | 0 | 118 | 212 | 199 | 0 | 435 | 0 | 0 | 0 | 886 |
| 1997 | 277 | 574 | 26 | 434 | 969 | 469 | 237 | 292 | 284 | 0 | 0 | 0 |
| 1998 | 0 | 612 | 0 | 749 | 320 | 244 | 289 | 0 | 250 | 253 | 120 | 0 |
| 1999 | 0 | 0 | 700 | 579 | 617 | 1,225 | 243 | 250 | 0 | 762 | 327 | 642 |
| 2000 | 800 | 971 | 608 | 0 | 0 | 3 | 0 | 0 | 901 | 888 | 776 | 623 |
| 2001 | 14 | 811 | 470 | 879 | 172 | 1,123 | 0 | 469 | 0 | 0 | 0 | 302 |
| 2002 | 397 | 174 | 313 | 356 | 313 | 619 | 0 | 670 | 926 | 0 | 122 | 0 |
| 2003 | 318 | 0 | 106 | 318 | 461 | 516 | 218 | 271 | 133 | 450 | 466 | 219 |
| 2004 | 150 | 647 | 933 | 577 | 554 | 624 | 1,018 | 71 | 141 | 276 | 389 | |
| 2005 | 596 | 245 | 430 | 954 | 46 | 398 | 424 | 750 | 712 | 411 | ||
| 2006 | 716 | 746 | 219 | 884 | 698 | 926 | 646 | 1,375 | 286 | 71 | 935 | |
| 2007 | 620 | 141 | 508 | 1,155 | 1,422 | 1,433 | 1,193 | 81 | 1,388 | 499 | ||
| 2008 | 403 | 167 | 622 | 268 | 522 | 685 | 517 | 509 | 613 | 333 | 130 | |
| 2009 | 1,075 | 227 | 131 | 20 | 39 | 452 | 707 | 45 | 22 | 458 | 339 | 803 |
| 2010 | 9 | 215 | 4 | 928 | 1,249 | 360 | 577 | 314 | 531 | 260 | 373 | 326 |
| 2011 | 110 | 319 | 162 | 214 | 269 | 198 | 327 | |||||
| 2012 | 79 | 8 | 98 | 358 | 915 | 503 | 465 | 1,291 | 43 | 47 | 174 | 218 |
| 2013 | 69 | 199 | 36 | 861 | 473 | 414 | 308 | 145 | 407 | 381 | 151 | 33 |
| 2014 | 383 | 433 | 555 | 167 | 283 | 215 | 88 | 44 | 628 | 780 | ||
| 2015 | 59 | 110 | 31 | 827 | 962 | 431 | 1,154 | 1,876 | 1,032 | 331 | 187 | 468 |
| 2016 | 86 | 101 | 815 | 1,454 | 498 | 757 | 329 | 533 | 110 | 326 | ||
| 2017 | 1,053 | 149 | 579 | 1,031 | 176 | 115 | 69 | 72 | ||||
| 2018 | 130 | 1,049 | 284 | 1,359 | 1,580 | 1,007 | 1,291 | 346 | 1,003 | |||
| 2019 | 570 | 539 | 2,859 | 659 | 1,543 | 725 | 243 | 209 | 120 | 317 | ||
| 2020 | 289 | 536 | 1,283 | 543 | 825 | 316 | 148 | 312 | 328 | |||
| 2021 | 285 | 333 | 922 | 1,562 | 638 | 1,557 | 583 | 315 | 256 | 93 | 2 | 156 |
| 2022 | 324 | 368 | 974 | 36 | 365 | 111 | 26 | 61 | 249 | |||
| 2023 | 340 | 338 | 401 | 124 | 798 | 243 | 258 | 278 | 96 | 103 | 12 | |
| - = No Data Reported; -- = Not Applicable; NA = Not Available; W = Withheld to avoid disclosure of individual company data. |
| Release Date: 3/29/2024 |
| Next Release Date: 4/30/2024 |