|
Download Data (XLS File) |
|
||||||||
|
||||||||
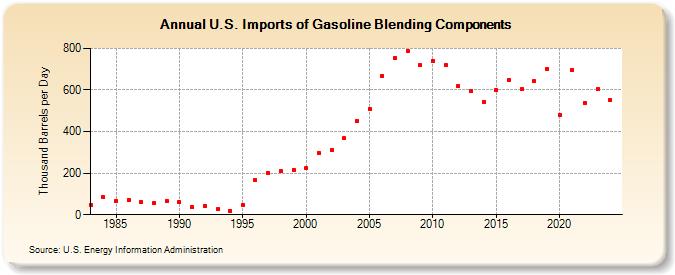
| U.S. Imports of Gasoline Blending Components (Thousand Barrels per Day) | ||||||||
| Decade | Year-0 | Year-1 | Year-2 | Year-3 | Year-4 | Year-5 | Year-6 | Year-7 | Year-8 | Year-9 |
|---|---|---|---|---|---|---|---|---|---|---|
| 1980's | 47 | 83 | 67 | 72 | 60 | 57 | 66 | |||
| 1990's | 62 | 36 | 41 | 27 | 20 | 48 | 166 | 200 | 209 | 217 |
| 2000's | 223 | 298 | 311 | 367 | 451 | 510 | 669 | 753 | 789 | 719 |
| 2010's | 741 | 718 | 619 | 596 | 544 | 599 | 649 | 604 | 641 | 701 |
| 2020's | 479 | 697 | 539 | 605 |
| - = No Data Reported; -- = Not Applicable; NA = Not Available; W = Withheld to avoid disclosure of individual company data. |
| Release Date: 3/29/2024 |
| Next Release Date: 8/30/2024 |