|
Download Data (XLS File) |
|
||||||||
|
||||||||
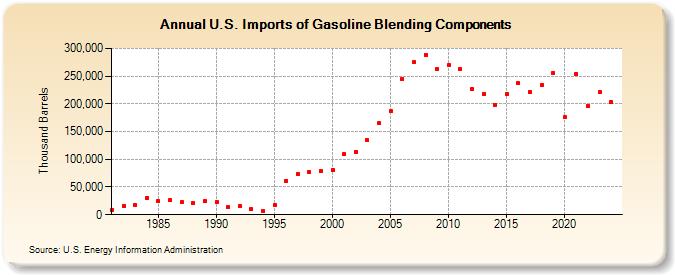
| U.S. Imports of Gasoline Blending Components (Thousand Barrels) | ||||||||
| Decade | Year-0 | Year-1 | Year-2 | Year-3 | Year-4 | Year-5 | Year-6 | Year-7 | Year-8 | Year-9 |
|---|---|---|---|---|---|---|---|---|---|---|
| 1980's | 8,724 | 15,508 | 16,992 | 30,358 | 24,347 | 26,433 | 22,045 | 20,970 | 24,038 | |
| 1990's | 22,665 | 13,065 | 15,050 | 9,984 | 7,350 | 17,427 | 60,935 | 73,148 | 76,249 | 79,226 |
| 2000's | 81,515 | 108,704 | 113,654 | 134,005 | 164,894 | 186,272 | 244,223 | 274,727 | 288,607 | 262,335 |
| 2010's | 270,354 | 262,045 | 226,515 | 217,512 | 198,466 | 218,607 | 237,401 | 220,528 | 233,841 | 255,956 |
| 2020's | 175,456 | 254,511 | 196,650 | 220,908 |
| - = No Data Reported; -- = Not Applicable; NA = Not Available; W = Withheld to avoid disclosure of individual company data. |
| Release Date: 3/29/2024 |
| Next Release Date: 8/30/2024 |