|
Download Data (XLS File) |
|
||||||||
|
||||||||
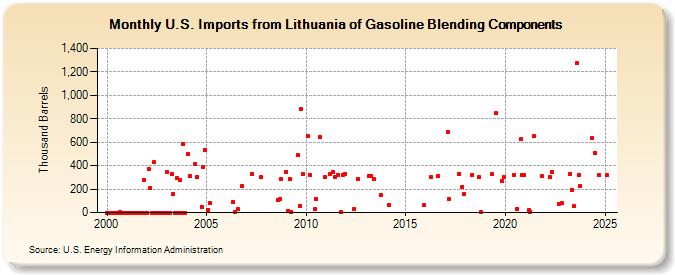
| U.S. Imports from Lithuania of Gasoline Blending Components (Thousand Barrels) | ||||||||
| Year | Jan | Feb | Mar | Apr | May | Jun | Jul | Aug | Sep | Oct | Nov | Dec |
|---|---|---|---|---|---|---|---|---|---|---|---|---|
| 2000 | 0 | 0 | 0 | 0 | 0 | 0 | 0 | 0 | 2 | 0 | 0 | 0 |
| 2001 | 0 | 0 | 0 | 0 | 0 | 0 | 0 | 0 | 0 | 0 | 278 | 0 |
| 2002 | 0 | 369 | 209 | 0 | 429 | 0 | 0 | 0 | 0 | 0 | 0 | 0 |
| 2003 | 349 | 0 | 0 | 330 | 160 | 0 | 293 | 0 | 275 | 0 | 581 | 0 |
| 2004 | 500 | 313 | 412 | 307 | 50 | 387 | 534 | |||||
| 2005 | 22 | 80 | ||||||||||
| 2006 | 94 | 1 | 28 | 226 | ||||||||
| 2007 | 328 | 300 | ||||||||||
| 2008 | 110 | 112 | 282 | |||||||||
| 2009 | 347 | 13 | 286 | 5 | 489 | 57 | 879 | 326 | ||||
| 2010 | 653 | 321 | 27 | 119 | 642 | 305 | ||||||
| 2011 | 325 | 342 | 300 | 324 | 9 | 323 | 327 | |||||
| 2012 | 32 | 288 | ||||||||||
| 2013 | 311 | 313 | 284 | 153 | ||||||||
| 2014 | 67 | |||||||||||
| 2015 | 65 | |||||||||||
| 2016 | 300 | 314 | ||||||||||
| 2017 | 691 | 119 | 328 | 222 | 161 | |||||||
| 2018 | 323 | 301 | 6 | |||||||||
| 2019 | 325 | 845 | 269 | 302 | ||||||||
| 2020 | 324 | 34 | 626 | 320 | 317 | |||||||
| 2021 | 19 | 5 | 654 | 308 | ||||||||
| 2022 | 300 | 350 | 76 | 79 | ||||||||
| 2023 | 333 | 193 | 52 | 1,273 | 132 | 225 | ||||||
| - = No Data Reported; -- = Not Applicable; NA = Not Available; W = Withheld to avoid disclosure of individual company data. |
| Release Date: 3/29/2024 |
| Next Release Date: 4/30/2024 |