|
Download Data (XLS File) |
|
||||||||
|
||||||||
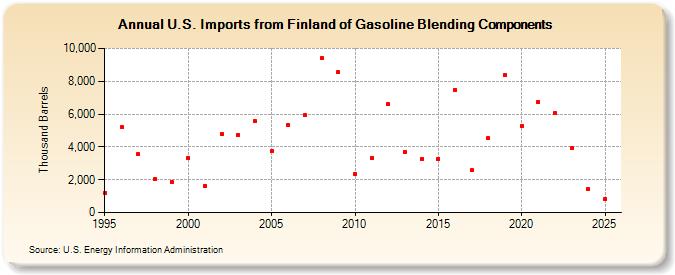
| U.S. Imports from Finland of Gasoline Blending Components (Thousand Barrels) | ||||||||
| Decade | Year-0 | Year-1 | Year-2 | Year-3 | Year-4 | Year-5 | Year-6 | Year-7 | Year-8 | Year-9 |
|---|---|---|---|---|---|---|---|---|---|---|
| 1990's | 1,210 | 5,188 | 3,541 | 2,050 | 1,887 | |||||
| 2000's | 3,343 | 1,643 | 4,796 | 4,713 | 5,552 | 3,774 | 5,347 | 5,923 | 9,419 | 8,532 |
| 2010's | 2,337 | 3,314 | 6,594 | 3,719 | 3,285 | 3,291 | 7,494 | 2,592 | 4,540 | 8,355 |
| 2020's | 5,296 | 6,726 | 6,044 | 3,931 |
| - = No Data Reported; -- = Not Applicable; NA = Not Available; W = Withheld to avoid disclosure of individual company data. |
| Release Date: 3/29/2024 |
| Next Release Date: 8/30/2024 |