|
Download Data (XLS File) |
|
||||||||
|
||||||||
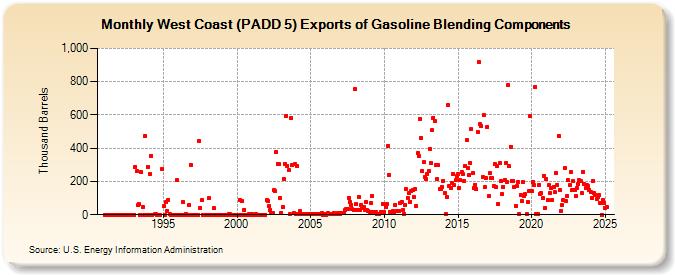
| West Coast (PADD 5) Exports of Gasoline Blending Components (Thousand Barrels) | ||||||||
| Year | Jan | Feb | Mar | Apr | May | Jun | Jul | Aug | Sep | Oct | Nov | Dec |
|---|---|---|---|---|---|---|---|---|---|---|---|---|
| 1991 | 0 | 0 | 0 | 0 | 0 | 0 | 0 | 0 | 0 | 0 | 0 | 0 |
| 1992 | 0 | 0 | 0 | 0 | 0 | 0 | 0 | 0 | 0 | 0 | 0 | 0 |
| 1993 | 0 | 288 | 260 | 56 | 62 | 1 | 254 | 49 | 1 | 474 | 0 | 289 |
| 1994 | 0 | 246 | 355 | 0 | 2 | 2 | 1 | 0 | 1 | 275 | ||
| 1995 | 50 | 0 | 76 | 25 | 89 | 2 | 0 | 0 | 1 | 1 | 0 | 207 |
| 1996 | 0 | 0 | 0 | 0 | 75 | 0 | 7 | 0 | 0 | 59 | 301 | 0 |
| 1997 | 0 | 0 | 0 | 0 | 0 | 441 | 41 | 87 | 0 | 0 | 0 | 0 |
| 1998 | 0 | 100 | 0 | 0 | 0 | 40 | 0 | 0 | 0 | 0 | 0 | 0 |
| 1999 | 0 | 0 | 0 | 0 | 0 | 7 | 2 | 0 | 0 | 1 | 1 | 0 |
| 2000 | 0 | 0 | 89 | 0 | 81 | 0 | 30 | 0 | 0 | 0 | 4 | 0 |
| 2001 | 2 | 1 | 0 | 4 | 0 | 1 | 0 | 1 | 1 | 0 | 0 | 1 |
| 2002 | 88 | 85 | 50 | 27 | 9 | 10 | 148 | 142 | 376 | 304 | 303 | 103 |
| 2003 | 11 | 46 | 217 | 306 | 595 | 293 | 266 | 2 | 582 | 299 | 10 | 304 |
| 2004 | 4 | 292 | 4 | 20 | 6 | 2 | 3 | 2 | 4 | 3 | 7 | 3 |
| 2005 | 3 | 6 | 4 | 3 | 5 | 6 | 3 | 5 | 2 | 9 | 0 | 3 |
| 2006 | 0 | 2 | 10 | 4 | 6 | 5 | 7 | 10 | 7 | 6 | 9 | 9 |
| 2007 | 6 | 10 | 9 | 8 | 26 | 32 | 35 | 103 | 77 | 57 | 32 | 29 |
| 2008 | 753 | 63 | 30 | 109 | 31 | 59 | 39 | 48 | 29 | 78 | 26 | 21 |
| 2009 | 14 | 72 | 111 | 14 | 17 | 16 | 3 | 5 | 6 | 15 | 17 | 65 |
| 2010 | 19 | 47 | 63 | 416 | 240 | 18 | 19 | 20 | 18 | 61 | 23 | 23 |
| 2011 | 20 | 72 | 79 | 30 | 6 | 61 | 154 | 102 | 130 | 78 | 145 | 150 |
| 2012 | 104 | 154 | 53 | 371 | 352 | 578 | 464 | 263 | 316 | 227 | 214 | 245 |
| 2013 | 263 | 397 | 312 | 508 | 584 | 563 | 296 | 216 | 296 | 154 | 152 | 169 |
| 2014 | 204 | 132 | 3 | 105 | 659 | 173 | 161 | 189 | 247 | 177 | 206 | 230 |
| 2015 | 245 | 161 | 206 | 257 | 244 | 203 | 292 | 449 | 282 | 240 | 312 | 514 |
| 2016 | 252 | 163 | 180 | 153 | 498 | 917 | 543 | 535 | 226 | 598 | 167 | 220 |
| 2017 | 528 | 110 | 248 | 222 | 218 | 174 | 306 | 166 | 293 | 66 | 311 | 201 |
| 2018 | 125 | 167 | 206 | 312 | 194 | 781 | 291 | 409 | 205 | 202 | 165 | 55 |
| 2019 | 171 | 197 | 2 | 118 | 82 | 196 | 111 | 123 | 4 | 76 | 144 | 591 |
| 2020 | 142 | 197 | 179 | 768 | 4 | 2 | 181 | 125 | 129 | 99 | 235 | 43 |
| 2021 | 213 | 86 | 177 | 131 | 159 | 91 | 169 | 136 | 251 | 180 | 475 | 148 |
| 2022 | 24 | 60 | 90 | 282 | 85 | 110 | 207 | 178 | 257 | 147 | 201 | 149 |
| 2023 | 143 | 163 | 186 | 197 | 200 | 130 | 233 | 221 | 158 | 176 | 170 | 151 |
| 2024 | 135 | |||||||||||
| - = No Data Reported; -- = Not Applicable; NA = Not Available; W = Withheld to avoid disclosure of individual company data. |
| Release Date: 3/29/2024 |
| Next Release Date: 4/30/2024 |