|
Download Data (XLS File) |
|
||||||||
|
||||||||
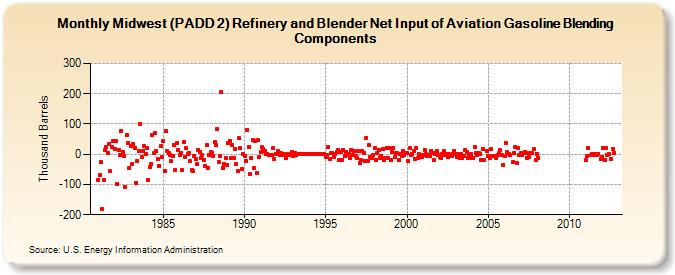
| Midwest (PADD 2) Refinery and Blender Net Input of Aviation Gasoline Blending Components (Thousand Barrels) | ||||||||
| Year | Jan | Feb | Mar | Apr | May | Jun | Jul | Aug | Sep | Oct | Nov | Dec |
|---|---|---|---|---|---|---|---|---|---|---|---|---|
| 1981 | -84 | -69 | -26 | -180 | -84 | 15 | 23 | 4 | 35 | -57 | 24 | 44 |
| 1982 | 17 | 43 | -97 | 14 | -1 | 76 | 6 | -6 | -107 | 65 | 38 | -45 |
| 1983 | 26 | -33 | 33 | 20 | -94 | -23 | 9 | 99 | -10 | 10 | 26 | 2 |
| 1984 | 19 | -85 | -43 | -31 | 62 | 4 | 70 | 9 | -17 | -38 | 28 | -8 |
| 1985 | 43 | -57 | 78 | 10 | 3 | -3 | -24 | -5 | 30 | -52 | 37 | 15 |
| 1986 | -4 | 5 | -52 | 41 | -8 | 21 | 1 | 5 | -24 | -51 | -57 | -5 |
| 1987 | -15 | -32 | 15 | 7 | -14 | -2 | -18 | -40 | 32 | -46 | -4 | 8 |
| 1988 | 3 | -5 | 39 | 32 | 83 | -25 | -7 | 205 | -44 | -33 | -12 | -34 |
| 1989 | 37 | 44 | -13 | 32 | -11 | 18 | -33 | -54 | 52 | 20 | -50 | 1 |
| 1990 | -7 | -21 | 81 | 25 | -64 | -12 | 46 | -45 | 44 | -62 | 48 | -8 |
| 1991 | 7 | 23 | 17 | 9 | 0 | 0 | -1 | -2 | -4 | 19 | -15 | 1 |
| 1992 | 1 | 9 | -3 | 3 | -4 | 1 | -3 | -12 | 0 | -1 | -4 | 8 |
| 1993 | -5 | 3 | -4 | 0 | 0 | 0 | 0 | 0 | 0 | 0 | 0 | 0 |
| 1994 | 0 | 0 | 0 | 0 | 0 | 0 | 0 | 0 | 0 | 0 | 0 | 0 |
| 1995 | -9 | -4 | 25 | -17 | 3 | 3 | -8 | 2 | 7 | 13 | -18 | 8 |
| 1996 | -19 | 15 | -7 | 8 | -2 | 0 | -12 | 15 | -4 | 11 | -6 | -14 |
| 1997 | 9 | -29 | -18 | 11 | 3 | -24 | 53 | -24 | 29 | -8 | -14 | -2 |
| 1998 | 19 | -19 | 4 | 13 | -11 | -7 | 17 | -19 | -12 | 22 | -13 | 20 |
| 1999 | -20 | 6 | 19 | -10 | 4 | 3 | -20 | 2 | -7 | 11 | -1 | 4 |
| 2000 | 3 | -24 | 20 | -2 | 0 | 12 | -17 | 22 | -12 | 0 | -8 | -10 |
| 2001 | -4 | 15 | 0 | -5 | -3 | -7 | 12 | 5 | -19 | 2 | 10 | -1 |
| 2002 | -8 | -12 | 0 | 11 | -2 | 0 | -8 | 0 | -4 | -6 | 0 | 11 |
| 2003 | 0 | -10 | 0 | -11 | 0 | -12 | -5 | 13 | 8 | -11 | -1 | 0 |
| 2004 | -12 | -13 | 23 | 4 | -1 | 5 | 2 | -18 | 17 | -20 | 12 | |
| 2005 | -5 | -11 | 18 | -6 | -5 | -14 | -2 | 5 | 13 | -3 | -37 | |
| 2006 | -7 | 38 | 7 | 2 | -3 | -26 | 3 | 24 | -29 | 21 | -4 | |
| 2007 | 3 | -2 | 3 | 7 | 5 | -13 | -9 | 3 | 3 | 16 | -20 | |
| 2008 | 2 | -11 | ||||||||||
| 2011 | -20 | -6 | 22 | -1 | 2 | -1 | 1 | -1 | 1 | -16 | ||
| 2012 | -8 | 21 | -18 | 19 | -2 | 2 | -17 | 17 | 3 | |||
| - = No Data Reported; -- = Not Applicable; NA = Not Available; W = Withheld to avoid disclosure of individual company data. |
| Release Date: 3/29/2024 |
| Next Release Date: 4/30/2024 |