|
Download Data (XLS File) |
|
||||||||
|
||||||||
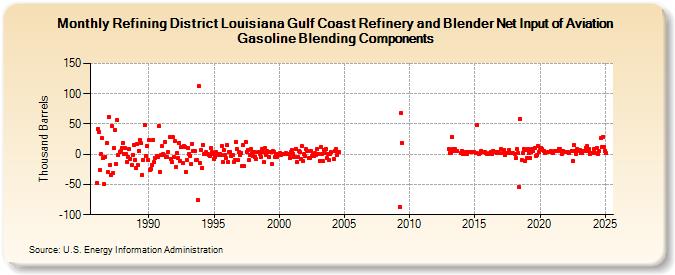
| Refining District Louisiana Gulf Coast Refinery and Blender Net Input of Aviation Gasoline Blending Components (Thousand Barrels) | ||||||||
| Year | Jan | Feb | Mar | Apr | May | Jun | Jul | Aug | Sep | Oct | Nov | Dec |
|---|---|---|---|---|---|---|---|---|---|---|---|---|
| 1986 | -47 | 42 | 36 | -26 | 0 | 26 | -7 | -49 | -4 | 18 | -29 | 62 |
| 1987 | -18 | -34 | 47 | -31 | 10 | 40 | -16 | 57 | -1 | 4 | 5 | 10 |
| 1988 | 19 | 0 | 11 | 0 | -13 | -4 | 8 | -8 | -18 | -1 | 16 | -9 |
| 1989 | -23 | 17 | -18 | 6 | 24 | 18 | -34 | -9 | 49 | -3 | 14 | -9 |
| 1990 | 23 | -26 | -24 | -18 | 24 | -13 | -7 | -3 | -4 | 46 | -29 | -1 |
| 1991 | 13 | 0 | -2 | 20 | -5 | -5 | 3 | 28 | -8 | -13 | 28 | -5 |
| 1992 | 22 | -21 | 2 | -6 | 19 | -11 | 12 | -15 | 14 | 12 | -29 | -9 |
| 1993 | 11 | 1 | -3 | -16 | 17 | 5 | 5 | -10 | -9 | -75 | 112 | -14 |
| 1994 | 7 | -22 | 16 | 0 | 0 | 3 | 1 | -1 | -3 | 10 | 3 | 0 |
| 1995 | -8 | -5 | 3 | 0 | -2 | 1 | -2 | 13 | -13 | 7 | -1 | -6 |
| 1996 | 15 | -13 | 3 | 4 | -3 | -2 | -13 | -9 | 20 | 9 | -10 | 3 |
| 1997 | -2 | 2 | -20 | 16 | -20 | 21 | 4 | 7 | -10 | -2 | 9 | 2 |
| 1998 | -3 | 4 | -4 | -8 | 3 | 3 | 1 | -5 | 8 | 3 | -13 | 10 |
| 1999 | -1 | 5 | 4 | -5 | 3 | -16 | 6 | 4 | -5 | 0 | -4 | 0 |
| 2000 | -1 | 2 | -2 | 1 | 1 | 0 | 2 | 1 | 1 | 1 | -6 | 3 |
| 2001 | 7 | 1 | -4 | 9 | -13 | -4 | 6 | 4 | -8 | 13 | -12 | 0 |
| 2002 | -3 | 8 | 6 | -7 | -7 | 6 | -3 | 1 | -3 | 2 | -1 | 9 |
| 2003 | 1 | -12 | 12 | 1 | -11 | 7 | 2 | 9 | -7 | 0 | -10 | 0 |
| 2004 | 3 | -8 | 6 | 8 | -1 | 3 | 3 | |||||
| 2009 | -87 | 68 | 19 | |||||||||
| 2012 | 7 | |||||||||||
| 2013 | 8 | 2 | 2 | 29 | 8 | 5 | 8 | 5 | 6 | 2 | ||
| 2014 | 6 | 1 | 1 | 4 | 1 | 4 | 4 | 4 | 3 | |||
| 2015 | 2 | 49 | 1 | 2 | 6 | 3 | 3 | 2 | 1 | |||
| 2016 | 1 | 2 | 4 | 1 | 6 | 3 | 3 | 2 | 4 | 2 | ||
| 2017 | 8 | 2 | 7 | -1 | 2 | 2 | 7 | 2 | 2 | |||
| 2018 | 1 | -7 | 8 | 2 | -55 | 58 | -9 | 2 | 9 | -12 | 7 | |
| 2019 | -7 | 9 | 2 | -6 | 4 | 9 | 6 | 10 | -3 | -2 | 14 | 3 |
| 2020 | 7 | 11 | 8 | 6 | 2 | 3 | 4 | 5 | ||||
| 2021 | 2 | 5 | 5 | 5 | 9 | 8 | 6 | 1 | 5 | |||
| 2022 | 4 | 4 | 2 | 6 | -11 | 15 | 5 | 1 | 8 | 5 | ||
| 2023 | 6 | 7 | 2 | 2 | 6 | 5 | 11 | 13 | 6 | 8 | 1 | 2 |
| 2024 | 2 | 2 | 9 | 2 | ||||||||
| - = No Data Reported; -- = Not Applicable; NA = Not Available; W = Withheld to avoid disclosure of individual company data. |
| Release Date: 6/28/2024 |
| Next Release Date: 7/31/2024 |