|
Download Data (XLS File) |
|
||||||||
|
||||||||
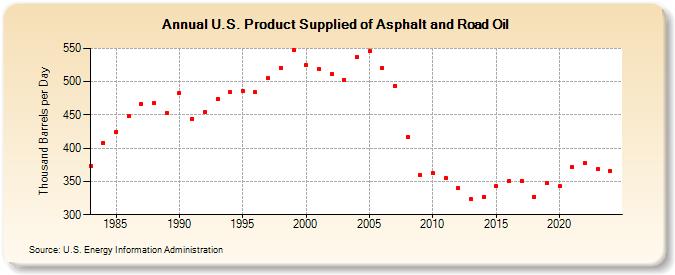
| U.S. Product Supplied of Asphalt and Road Oil (Thousand Barrels per Day) | ||||||||
| Decade | Year-0 | Year-1 | Year-2 | Year-3 | Year-4 | Year-5 | Year-6 | Year-7 | Year-8 | Year-9 |
|---|---|---|---|---|---|---|---|---|---|---|
| 1980's | 373 | 408 | 425 | 448 | 467 | 468 | 453 | |||
| 1990's | 483 | 444 | 454 | 474 | 484 | 486 | 484 | 505 | 521 | 547 |
| 2000's | 525 | 519 | 512 | 503 | 537 | 546 | 521 | 494 | 417 | 360 |
| 2010's | 362 | 355 | 340 | 323 | 327 | 343 | 351 | 351 | 327 | 348 |
| 2020's | 343 | 371 | 378 | 368 |
| - = No Data Reported; -- = Not Applicable; NA = Not Available; W = Withheld to avoid disclosure of individual company data. |
| Release Date: 8/30/2024 |
| Next Release Date: 8/29/2025 |