|
Download Data (XLS File) |
|
||||||||
|
||||||||
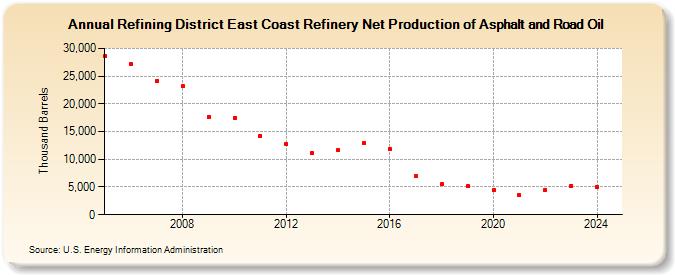
| Refining District East Coast Refinery Net Production of Asphalt and Road Oil (Thousand Barrels) | ||||||||
| Decade | Year-0 | Year-1 | Year-2 | Year-3 | Year-4 | Year-5 | Year-6 | Year-7 | Year-8 | Year-9 |
|---|---|---|---|---|---|---|---|---|---|---|
| 2000's | 28,711 | 27,138 | 24,086 | 23,204 | 17,639 | |||||
| 2010's | 17,504 | 14,223 | 12,797 | 11,058 | 11,619 | 12,956 | 11,846 | 6,900 | 5,451 | 5,147 |
| 2020's | 4,449 | 3,477 | 4,541 | 5,263 |
| - = No Data Reported; -- = Not Applicable; NA = Not Available; W = Withheld to avoid disclosure of individual company data. |
| Release Date: 8/30/2024 |
| Next Release Date: 8/29/2025 |