|
Download Data (XLS File) |
|
||||||||
|
||||||||
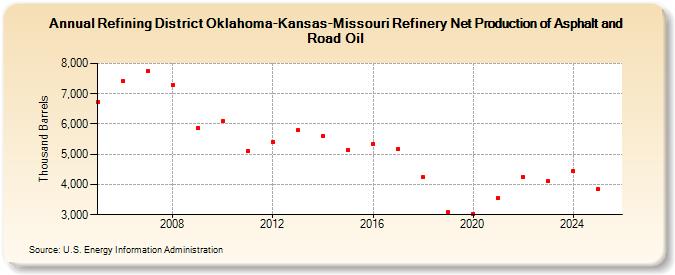
| Refining District Oklahoma-Kansas-Missouri Refinery Net Production of Asphalt and Road Oil (Thousand Barrels) | ||||||||
| Decade | Year-0 | Year-1 | Year-2 | Year-3 | Year-4 | Year-5 | Year-6 | Year-7 | Year-8 | Year-9 |
|---|---|---|---|---|---|---|---|---|---|---|
| 2000's | 6,732 | 7,413 | 7,745 | 7,298 | 5,883 | |||||
| 2010's | 6,098 | 5,102 | 5,416 | 5,792 | 5,597 | 5,150 | 5,330 | 5,172 | 4,231 | 3,080 |
| 2020's | 3,030 | 3,563 | 4,256 | 4,103 |
| - = No Data Reported; -- = Not Applicable; NA = Not Available; W = Withheld to avoid disclosure of individual company data. |
| Release Date: 3/29/2024 |
| Next Release Date: 8/30/2024 |