|
Download Data (XLS File) |
|
||||||||
|
||||||||
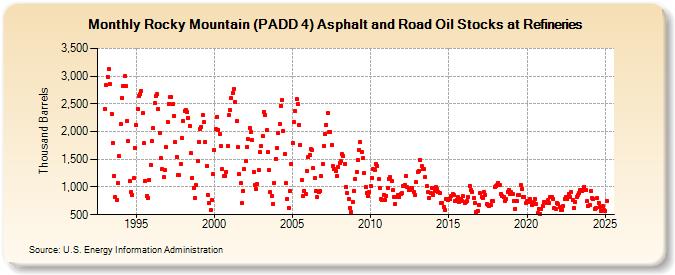
| Rocky Mountain (PADD 4) Asphalt and Road Oil Stocks at Refineries (Thousand Barrels) | ||||||||
| Year | Jan | Feb | Mar | Apr | May | Jun | Jul | Aug | Sep | Oct | Nov | Dec |
|---|---|---|---|---|---|---|---|---|---|---|---|---|
| 1993 | 2,399 | 2,833 | 2,990 | 3,123 | 2,857 | 2,322 | 1,799 | 1,206 | 816 | 770 | 1,065 | 1,553 |
| 1994 | 2,131 | 2,613 | 2,816 | 2,996 | 2,827 | 2,197 | 1,825 | 1,103 | 903 | 853 | 1,155 | 1,710 |
| 1995 | 2,121 | 2,406 | 2,637 | 2,675 | 2,727 | 2,331 | 1,787 | 1,111 | 839 | 810 | 1,123 | 1,398 |
| 1996 | 1,823 | 2,057 | 2,507 | 2,644 | 2,681 | 2,410 | 1,981 | 1,519 | 1,317 | 1,173 | 1,299 | 1,717 |
| 1997 | 2,175 | 2,504 | 2,620 | 2,615 | 2,495 | 2,284 | 1,804 | 1,548 | 1,219 | 1,210 | 1,416 | 1,890 |
| 1998 | 2,194 | 2,378 | 2,390 | 2,361 | 2,252 | 2,097 | 1,606 | 1,167 | 990 | 807 | 1,031 | 1,471 |
| 1999 | 1,815 | 2,053 | 2,089 | 2,302 | 2,164 | 1,812 | 1,381 | 858 | 715 | 579 | 765 | 1,233 |
| 2000 | 1,664 | 2,038 | 2,269 | 2,037 | 1,958 | 1,734 | 1,320 | 1,197 | 1,195 | 1,267 | 1,740 | 2,292 |
| 2001 | 2,385 | 2,600 | 2,691 | 2,766 | 2,542 | 2,193 | 1,714 | 1,228 | 1,070 | 708 | 935 | 1,324 |
| 2002 | 1,460 | 1,718 | 1,860 | 2,067 | 1,993 | 1,851 | 1,279 | 1,032 | 966 | 1,051 | 1,298 | 1,629 |
| 2003 | 1,735 | 1,913 | 2,354 | 2,305 | 2,019 | 1,628 | 1,301 | 907 | 841 | 697 | 1,081 | 1,506 |
| 2004 | 1,712 | 1,965 | 2,133 | 2,469 | 2,577 | 2,011 | 1,588 | 1,065 | 791 | 626 | 932 | 1,415 |
| 2005 | 1,791 | 2,164 | 2,373 | 2,583 | 2,488 | 2,125 | 1,763 | 1,119 | 841 | 928 | 872 | 1,293 |
| 2006 | 1,541 | 1,577 | 1,679 | 1,662 | 1,335 | 1,160 | 936 | 816 | 907 | 926 | 1,191 | 1,422 |
| 2007 | 1,742 | 1,953 | 2,125 | 2,330 | 1,986 | 1,997 | 1,765 | 1,383 | 1,332 | 1,295 | 1,199 | 1,363 |
| 2008 | 1,438 | 1,472 | 1,587 | 1,555 | 1,415 | 998 | 894 | 787 | 626 | 553 | 732 | 930 |
| 2009 | 1,149 | 1,277 | 1,489 | 1,675 | 1,808 | 1,626 | 1,525 | 1,248 | 991 | 897 | 841 | 918 |
| 2010 | 1,017 | 1,164 | 1,322 | 1,298 | 1,412 | 1,382 | 1,139 | 988 | 786 | 771 | 863 | 772 |
| 2011 | 844 | 988 | 1,153 | 1,180 | 1,107 | 937 | 813 | 699 | 826 | 858 | 814 | 877 |
| 2012 | 890 | 1,025 | 1,044 | 1,199 | 994 | 948 | 948 | 982 | 977 | 905 | 860 | 1,085 |
| 2013 | 1,277 | 1,295 | 1,495 | 1,370 | 1,320 | 1,325 | 1,176 | 1,016 | 912 | 810 | 884 | 988 |
| 2014 | 864 | 932 | 1,001 | 955 | 917 | 883 | 704 | 714 | 647 | 587 | 777 | 763 |
| 2015 | 777 | 786 | 829 | 871 | 849 | 744 | 773 | 823 | 731 | 781 | 754 | 836 |
| 2016 | 717 | 734 | 744 | 814 | 1,025 | 939 | 910 | 801 | 703 | 556 | 573 | 672 |
| 2017 | 883 | 821 | 797 | 918 | 859 | 688 | 676 | 665 | 668 | 747 | 747 | 997 |
| 2018 | 1,009 | 1,028 | 1,078 | 1,034 | 876 | 841 | 817 | 740 | 777 | 914 | 951 | 872 |
| 2019 | 902 | 870 | 755 | 612 | 744 | 849 | 860 | 1,030 | 960 | 826 | 825 | 706 |
| 2020 | 742 | 734 | 777 | 721 | 674 | 716 | 792 | 685 | 522 | 606 | 505 | 608 |
| 2021 | 663 | 729 | 734 | 712 | 760 | 705 | 813 | 819 | 787 | 615 | 606 | 714 |
| 2022 | 688 | 636 | 586 | 586 | 663 | 791 | 828 | 778 | 877 | 813 | 904 | 769 |
| 2023 | 627 | 653 | 818 | 849 | 899 | 969 | 920 | 939 | 1,002 | 938 | 841 | 663 |
| 2024 | 680 | |||||||||||
| - = No Data Reported; -- = Not Applicable; NA = Not Available; W = Withheld to avoid disclosure of individual company data. |
| Release Date: 3/29/2024 |
| Next Release Date: 4/30/2024 |