|
Download Data (XLS File) |
|
||||||||
|
||||||||
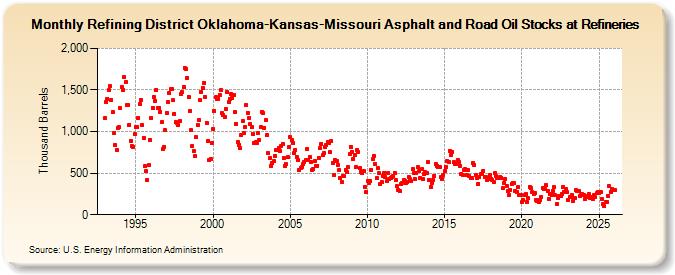
| Refining District Oklahoma-Kansas-Missouri Asphalt and Road Oil Stocks at Refineries (Thousand Barrels) | ||||||||
| Year | Jan | Feb | Mar | Apr | May | Jun | Jul | Aug | Sep | Oct | Nov | Dec |
|---|---|---|---|---|---|---|---|---|---|---|---|---|
| 1993 | 1,160 | 1,354 | 1,396 | 1,498 | 1,542 | 1,379 | 1,235 | 983 | 838 | 784 | 1,048 | 1,052 |
| 1994 | 1,280 | 1,538 | 1,505 | 1,655 | 1,594 | 1,319 | 1,315 | 1,084 | 892 | 829 | 815 | 969 |
| 1995 | 1,056 | 1,051 | 1,163 | 1,329 | 1,385 | 1,076 | 927 | 580 | 521 | 421 | 592 | 903 |
| 1996 | 1,165 | 1,287 | 1,421 | 1,372 | 1,500 | 1,282 | 1,281 | 1,236 | 1,109 | 791 | 820 | 1,014 |
| 1997 | 1,227 | 1,354 | 1,466 | 1,507 | 1,510 | 1,374 | 1,216 | 1,118 | 1,106 | 1,079 | 1,129 | 1,454 |
| 1998 | 1,472 | 1,534 | 1,770 | 1,753 | 1,648 | 1,420 | 1,249 | 1,013 | 826 | 765 | 704 | 931 |
| 1999 | 1,078 | 1,139 | 1,376 | 1,481 | 1,527 | 1,588 | 1,420 | 1,108 | 887 | 657 | 669 | 868 |
| 2000 | 1,028 | 1,250 | 1,411 | 1,391 | 1,395 | 1,441 | 1,501 | 1,221 | 1,197 | 1,179 | 1,271 | 1,475 |
| 2001 | 1,354 | 1,393 | 1,457 | 1,405 | 1,444 | 1,230 | 1,089 | 875 | 842 | 801 | 963 | 1,127 |
| 2002 | 983 | 1,059 | 1,322 | 1,228 | 1,167 | 1,087 | 1,051 | 973 | 863 | 874 | 858 | 980 |
| 2003 | 896 | 1,051 | 1,239 | 1,218 | 1,046 | 1,138 | 959 | 742 | 678 | 588 | 619 | 644 |
| 2004 | 708 | 784 | 782 | 797 | 771 | 828 | 852 | 683 | 586 | 604 | 690 | 810 |
| 2005 | 937 | 897 | 866 | 748 | 782 | 698 | 656 | 539 | 562 | 577 | 608 | 637 |
| 2006 | 654 | 792 | 660 | 692 | 639 | 536 | 544 | 645 | 589 | 590 | 686 | 800 |
| 2007 | 855 | 719 | 741 | 818 | 840 | 877 | 858 | 750 | 881 | 626 | 477 | 655 |
| 2008 | 649 | 600 | 539 | 440 | 396 | 467 | 464 | 539 | 509 | 570 | 729 | 819 |
| 2009 | 760 | 674 | 713 | 570 | 775 | 755 | 558 | 518 | 498 | 523 | 337 | 271 |
| 2010 | 406 | 382 | 403 | 537 | 668 | 709 | 608 | 444 | 556 | 498 | 371 | 390 |
| 2011 | 468 | 505 | 452 | 407 | 497 | 425 | 447 | 459 | 464 | 506 | 413 | 340 |
| 2012 | 300 | 282 | 364 | 385 | 412 | 409 | 381 | 397 | 452 | 426 | 402 | 545 |
| 2013 | 501 | 425 | 504 | 568 | 522 | 443 | 544 | 435 | 492 | 509 | 500 | 628 |
| 2014 | 418 | 336 | 384 | 415 | 470 | 611 | 591 | 570 | 573 | 456 | 435 | 481 |
| 2015 | 528 | 575 | 643 | 637 | 767 | 721 | 757 | 630 | 609 | 611 | 659 | 630 |
| 2016 | 589 | 491 | 476 | 534 | 544 | 476 | 535 | 467 | 446 | 440 | 621 | 602 |
| 2017 | 472 | 439 | 375 | 453 | 488 | 485 | 528 | 454 | 453 | 421 | 444 | 483 |
| 2018 | 434 | 417 | 390 | 500 | 462 | 440 | 444 | 456 | 446 | 318 | 383 | 434 |
| 2019 | 349 | 280 | 236 | 303 | 372 | 385 | 376 | 283 | 272 | 334 | 235 | 234 |
| 2020 | 148 | 179 | 238 | 250 | 156 | 197 | 339 | 317 | 271 | 255 | 256 | 180 |
| 2021 | 165 | 148 | 175 | 215 | 318 | 309 | 313 | 355 | 280 | 189 | 250 | 233 |
| 2022 | 291 | 329 | 233 | 127 | 198 | 224 | 231 | 251 | 336 | 277 | 310 | 270 |
| 2023 | 182 | 212 | 214 | 234 | 165 | 197 | 297 | 289 | 283 | 223 | 243 | 248 |
| 2024 | 272 | |||||||||||
| - = No Data Reported; -- = Not Applicable; NA = Not Available; W = Withheld to avoid disclosure of individual company data. |
| Release Date: 3/29/2024 |
| Next Release Date: 4/30/2024 |