|
Download Data (XLS File) |
|
||||||||
|
||||||||
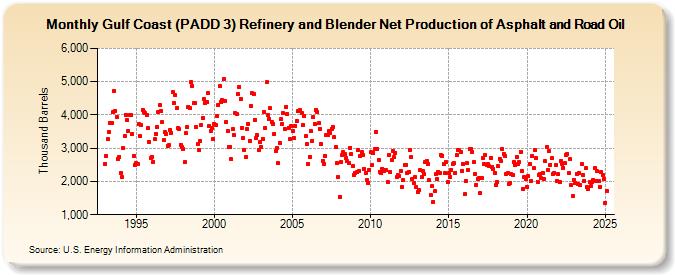
| Gulf Coast (PADD 3) Refinery and Blender Net Production of Asphalt and Road Oil (Thousand Barrels) | ||||||||
| Year | Jan | Feb | Mar | Apr | May | Jun | Jul | Aug | Sep | Oct | Nov | Dec |
|---|---|---|---|---|---|---|---|---|---|---|---|---|
| 1993 | 2,527 | 2,773 | 3,270 | 3,498 | 3,765 | 3,743 | 4,075 | 4,728 | 4,127 | 3,946 | 2,687 | 2,740 |
| 1994 | 2,247 | 2,122 | 3,012 | 3,365 | 4,010 | 3,846 | 3,516 | 4,009 | 4,005 | 3,427 | 2,774 | 2,490 |
| 1995 | 2,560 | 2,537 | 3,731 | 3,364 | 3,690 | 4,158 | 4,088 | 4,049 | 4,010 | 3,595 | 3,188 | 2,696 |
| 1996 | 2,747 | 2,586 | 3,271 | 3,432 | 3,649 | 4,102 | 4,295 | 4,116 | 3,774 | 3,242 | 3,477 | 3,427 |
| 1997 | 3,067 | 3,095 | 3,545 | 3,465 | 4,674 | 4,371 | 4,592 | 4,203 | 3,604 | 3,563 | 3,108 | 3,043 |
| 1998 | 2,987 | 2,581 | 3,446 | 3,622 | 4,252 | 4,210 | 4,982 | 4,875 | 4,349 | 4,351 | 3,637 | 3,112 |
| 1999 | 2,954 | 3,202 | 3,698 | 3,896 | 4,488 | 4,369 | 4,374 | 4,654 | 3,662 | 3,520 | 3,597 | 3,269 |
| 2000 | 3,731 | 3,711 | 3,966 | 4,289 | 4,866 | 4,388 | 4,446 | 5,071 | 4,411 | 3,793 | 3,512 | 3,047 |
| 2001 | 3,030 | 2,663 | 3,571 | 3,393 | 4,044 | 4,032 | 4,643 | 4,851 | 4,483 | 3,616 | 3,309 | 2,947 |
| 2002 | 2,733 | 3,575 | 3,736 | 3,215 | 4,272 | 4,644 | 4,614 | 3,858 | 3,294 | 3,387 | 2,931 | 3,175 |
| 2003 | 3,030 | 3,286 | 4,073 | 3,601 | 4,976 | 3,995 | 3,885 | 4,199 | 3,783 | 3,738 | 3,432 | 2,908 |
| 2004 | 2,992 | 2,551 | 3,170 | 3,863 | 3,734 | 4,048 | 3,572 | 4,250 | 4,037 | 3,619 | 3,262 | 3,668 |
| 2005 | 3,515 | 3,299 | 3,679 | 3,816 | 4,106 | 4,129 | 4,143 | 4,058 | 3,696 | 3,955 | 3,358 | 3,117 |
| 2006 | 2,535 | 2,744 | 3,504 | 3,226 | 3,936 | 3,740 | 4,152 | 4,095 | 3,755 | 3,591 | 3,119 | 2,624 |
| 2007 | 2,538 | 2,780 | 3,390 | 3,400 | 3,527 | 3,471 | 3,577 | 3,639 | 3,329 | 3,022 | 2,547 | 2,140 |
| 2008 | 1,544 | 2,581 | 2,799 | 2,880 | 2,838 | 2,717 | 2,601 | 2,566 | 3,014 | 2,818 | 2,456 | 2,196 |
| 2009 | 2,258 | 2,275 | 2,933 | 2,328 | 2,775 | 2,878 | 2,800 | 2,386 | 2,268 | 2,039 | 1,963 | 2,355 |
| 2010 | 2,873 | 2,482 | 2,867 | 2,979 | 3,496 | 2,982 | 2,655 | 2,297 | 2,254 | 2,383 | 2,306 | 2,341 |
| 2011 | 2,331 | 1,988 | 2,801 | 2,282 | 2,640 | 2,929 | 2,722 | 2,866 | 2,121 | 2,182 | 2,158 | 2,320 |
| 2012 | 1,836 | 2,037 | 2,494 | 2,502 | 2,251 | 2,291 | 2,956 | 2,733 | 2,072 | 1,944 | 2,119 | 1,820 |
| 2013 | 1,687 | 1,728 | 2,338 | 2,132 | 2,319 | 2,228 | 2,594 | 2,618 | 2,530 | 2,040 | 1,585 | 1,850 |
| 2014 | 1,386 | 1,702 | 2,223 | 2,072 | 2,299 | 2,239 | 2,792 | 2,780 | 2,523 | 2,243 | 2,588 | 1,970 |
| 2015 | 2,243 | 2,134 | 2,359 | 2,539 | 2,547 | 2,266 | 2,783 | 2,944 | 2,931 | 2,896 | 2,328 | 2,524 |
| 2016 | 1,614 | 2,006 | 2,548 | 2,336 | 2,970 | 2,970 | 2,887 | 2,582 | 2,215 | 1,899 | 2,072 | 2,101 |
| 2017 | 1,644 | 2,111 | 2,705 | 2,522 | 2,794 | 2,493 | 2,515 | 2,455 | 2,714 | 2,443 | 2,377 | 2,266 |
| 2018 | 1,885 | 1,976 | 2,455 | 2,679 | 2,614 | 2,983 | 2,834 | 2,770 | 2,216 | 2,242 | 1,912 | 1,965 |
| 2019 | 2,220 | 2,189 | 2,582 | 2,486 | 2,744 | 2,517 | 2,577 | 2,895 | 2,315 | 1,766 | 2,131 | 2,063 |
| 2020 | 1,843 | 2,152 | 2,529 | 2,021 | 2,753 | 2,408 | 2,947 | 2,705 | 1,991 | 2,207 | 2,227 | 2,092 |
| 2021 | 2,259 | 2,077 | 2,604 | 3,031 | 2,349 | 2,902 | 2,508 | 2,694 | 2,233 | 2,265 | 2,495 | 2,027 |
| 2022 | 2,211 | 1,973 | 2,625 | 2,519 | 2,418 | 2,547 | 2,806 | 2,831 | 2,253 | 2,665 | 1,880 | 1,551 |
| 2023 | 2,057 | 1,962 | 2,229 | 1,934 | 2,267 | 1,900 | 2,519 | 2,198 | 2,019 | 2,391 | 1,835 | 1,777 |
| 2024 | 1,989 | |||||||||||
| - = No Data Reported; -- = Not Applicable; NA = Not Available; W = Withheld to avoid disclosure of individual company data. |
| Release Date: 3/29/2024 |
| Next Release Date: 4/30/2024 |