|
Download Data (XLS File) |
|
||||||||
|
||||||||
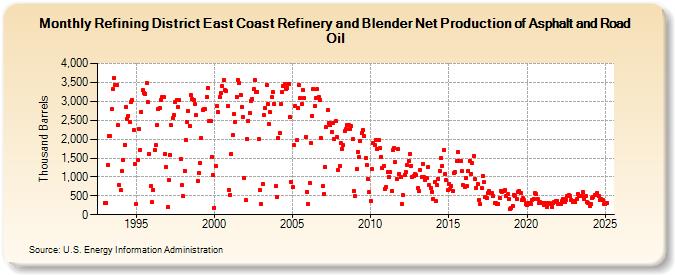
| Refining District East Coast Refinery and Blender Net Production of Asphalt and Road Oil (Thousand Barrels) | ||||||||
| Year | Jan | Feb | Mar | Apr | May | Jun | Jul | Aug | Sep | Oct | Nov | Dec |
|---|---|---|---|---|---|---|---|---|---|---|---|---|
| 1993 | 316 | 308 | 1,316 | 2,081 | 2,078 | 2,799 | 3,316 | 3,617 | 3,420 | 3,424 | 2,366 | 782 |
| 1994 | 647 | 1,151 | 1,457 | 1,853 | 2,853 | 2,540 | 2,614 | 2,461 | 2,992 | 3,021 | 2,235 | 1,330 |
| 1995 | 273 | 1,445 | 2,267 | 1,720 | 2,725 | 3,297 | 3,228 | 3,200 | 3,486 | 2,985 | 1,614 | 750 |
| 1996 | 332 | 664 | 1,707 | 1,839 | 2,371 | 2,796 | 2,829 | 3,035 | 3,108 | 3,113 | 1,603 | 1,260 |
| 1997 | 195 | 925 | 1,588 | 2,363 | 2,558 | 2,632 | 2,968 | 3,036 | 2,861 | 3,026 | 1,466 | 774 |
| 1998 | 488 | 1,157 | 1,971 | 2,451 | 2,741 | 2,354 | 3,156 | 3,073 | 3,033 | 2,918 | 2,628 | 902 |
| 1999 | 1,093 | 1,366 | 2,025 | 2,782 | 2,795 | 2,786 | 3,114 | 3,352 | 2,469 | 2,476 | 1,528 | 1,039 |
| 2000 | 189 | 1,282 | 2,871 | 2,709 | 3,112 | 3,224 | 3,399 | 3,563 | 3,301 | 3,279 | 2,887 | 661 |
| 2001 | 518 | 1,608 | 2,102 | 2,659 | 2,456 | 3,124 | 3,565 | 3,492 | 3,174 | 2,855 | 2,596 | 982 |
| 2002 | 388 | 1,997 | 2,486 | 2,701 | 3,018 | 3,065 | 3,324 | 3,564 | 3,233 | 3,249 | 1,993 | 643 |
| 2003 | 289 | 824 | 2,629 | 2,811 | 3,422 | 2,925 | 2,399 | 2,704 | 3,104 | 3,234 | 2,921 | 749 |
| 2004 | 477 | 2,035 | 2,162 | 2,922 | 3,252 | 3,392 | 3,462 | 3,333 | 3,361 | 3,463 | 2,577 | 871 |
| 2005 | 727 | 1,837 | 2,864 | 1,969 | 2,831 | 3,423 | 3,087 | 2,917 | 3,295 | 3,089 | 2,065 | 607 |
| 2006 | 275 | 849 | 1,892 | 2,623 | 3,321 | 2,865 | 3,082 | 3,321 | 3,113 | 3,031 | 2,017 | 749 |
| 2007 | 561 | 1,275 | 2,319 | 2,766 | 2,438 | 2,372 | 2,197 | 2,437 | 2,003 | 2,472 | 2,059 | 1,187 |
| 2008 | 1,283 | 1,884 | 1,749 | 1,837 | 2,204 | 2,257 | 2,383 | 2,373 | 2,271 | 2,334 | 2,000 | 629 |
| 2009 | 485 | 1,205 | 1,666 | 1,517 | 1,953 | 2,160 | 2,240 | 2,069 | 1,502 | 1,313 | 940 | 589 |
| 2010 | 367 | 1,197 | 1,890 | 1,835 | 1,988 | 1,744 | 1,974 | 1,766 | 1,535 | 1,224 | 1,301 | 684 |
| 2011 | 729 | 1,125 | 1,001 | 1,125 | 627 | 1,712 | 1,764 | 1,384 | 939 | 1,729 | 1,086 | 1,002 |
| 2012 | 293 | 509 | 1,060 | 1,130 | 1,317 | 1,421 | 1,608 | 1,301 | 994 | 1,021 | 1,090 | 1,053 |
| 2013 | 702 | 617 | 1,188 | 997 | 1,350 | 989 | 917 | 970 | 1,256 | 780 | 697 | 595 |
| 2014 | 414 | 858 | 369 | 773 | 952 | 1,159 | 1,510 | 1,296 | 1,713 | 1,079 | 913 | 644 |
| 2015 | 825 | 679 | 767 | 615 | 1,116 | 1,118 | 1,409 | 1,661 | 1,416 | 1,427 | 1,143 | 781 |
| 2016 | 729 | 983 | 764 | 1,167 | 1,433 | 1,087 | 1,361 | 1,563 | 946 | 709 | 806 | 394 |
| 2017 | 283 | 715 | 1,026 | 855 | 463 | 437 | 574 | 625 | 570 | 574 | 508 | 315 |
| 2018 | 300 | 283 | 292 | 449 | 631 | 609 | 635 | 652 | 507 | 536 | 414 | 144 |
| 2019 | 184 | 239 | 524 | 491 | 420 | 612 | 625 | 578 | 376 | 431 | 388 | 279 |
| 2020 | 252 | 322 | 309 | 275 | 401 | 426 | 574 | 537 | 427 | 301 | 338 | 318 |
| 2021 | 308 | 254 | 317 | 196 | 312 | 303 | 296 | 216 | 303 | 326 | 355 | 362 |
| 2022 | 296 | 292 | 282 | 354 | 423 | 349 | 393 | 486 | 514 | 491 | 396 | 325 |
| 2023 | 370 | 345 | 403 | 551 | 498 | 498 | 485 | 605 | 422 | 494 | 330 | 298 |
| 2024 | 239 | |||||||||||
| - = No Data Reported; -- = Not Applicable; NA = Not Available; W = Withheld to avoid disclosure of individual company data. |
| Release Date: 3/29/2024 |
| Next Release Date: 4/30/2024 |