|
Download Data (XLS File) |
|
||||||||
|
||||||||
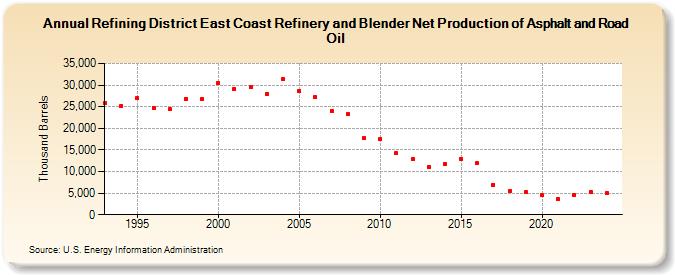
| Refining District East Coast Refinery and Blender Net Production of Asphalt and Road Oil (Thousand Barrels) | ||||||||
| Decade | Year-0 | Year-1 | Year-2 | Year-3 | Year-4 | Year-5 | Year-6 | Year-7 | Year-8 | Year-9 |
|---|---|---|---|---|---|---|---|---|---|---|
| 1990's | 25,823 | 25,154 | 26,990 | 24,657 | 24,392 | 26,872 | 26,825 | |||
| 2000's | 30,477 | 29,131 | 29,661 | 28,011 | 31,307 | 28,711 | 27,138 | 24,086 | 23,204 | 17,639 |
| 2010's | 17,505 | 14,223 | 12,797 | 11,058 | 11,680 | 12,957 | 11,942 | 6,945 | 5,452 | 5,147 |
| 2020's | 4,480 | 3,548 | 4,601 | 5,299 |
| - = No Data Reported; -- = Not Applicable; NA = Not Available; W = Withheld to avoid disclosure of individual company data. |
| Release Date: 3/29/2024 |
| Next Release Date: 8/30/2024 |