|
Download Data (XLS File) |
|
||||||||
|
||||||||
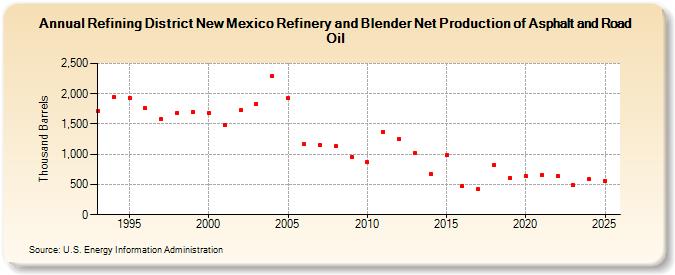
| Refining District New Mexico Refinery and Blender Net Production of Asphalt and Road Oil (Thousand Barrels) | ||||||||
| Decade | Year-0 | Year-1 | Year-2 | Year-3 | Year-4 | Year-5 | Year-6 | Year-7 | Year-8 | Year-9 |
|---|---|---|---|---|---|---|---|---|---|---|
| 1990's | 1,715 | 1,942 | 1,935 | 1,757 | 1,574 | 1,689 | 1,701 | |||
| 2000's | 1,683 | 1,482 | 1,726 | 1,838 | 2,285 | 1,923 | 1,163 | 1,145 | 1,129 | 962 |
| 2010's | 867 | 1,372 | 1,252 | 1,017 | 671 | 979 | 472 | 418 | 820 | 615 |
| 2020's | 639 | 659 | 644 | 483 |
| - = No Data Reported; -- = Not Applicable; NA = Not Available; W = Withheld to avoid disclosure of individual company data. |
| Release Date: 3/29/2024 |
| Next Release Date: 8/30/2024 |