|
Download Data (XLS File) |
|
||||||||
|
||||||||
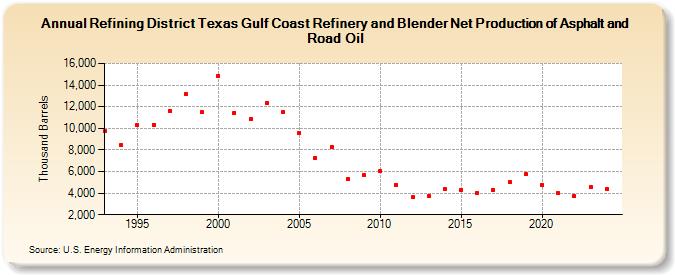
| Refining District Texas Gulf Coast Refinery and Blender Net Production of Asphalt and Road Oil (Thousand Barrels) | ||||||||
| Decade | Year-0 | Year-1 | Year-2 | Year-3 | Year-4 | Year-5 | Year-6 | Year-7 | Year-8 | Year-9 |
|---|---|---|---|---|---|---|---|---|---|---|
| 1990's | 9,725 | 8,483 | 10,342 | 10,343 | 11,646 | 13,166 | 11,494 | |||
| 2000's | 14,880 | 11,442 | 10,900 | 12,325 | 11,526 | 9,542 | 7,275 | 8,279 | 5,308 | 5,633 |
| 2010's | 6,061 | 4,774 | 3,616 | 3,718 | 4,377 | 4,321 | 3,981 | 4,311 | 5,006 | 5,724 |
| 2020's | 4,778 | 3,991 | 3,710 | 4,541 |
| - = No Data Reported; -- = Not Applicable; NA = Not Available; W = Withheld to avoid disclosure of individual company data. |
| Release Date: 3/29/2024 |
| Next Release Date: 8/30/2024 |