|
Download Data (XLS File) |
|
||||||||
|
||||||||
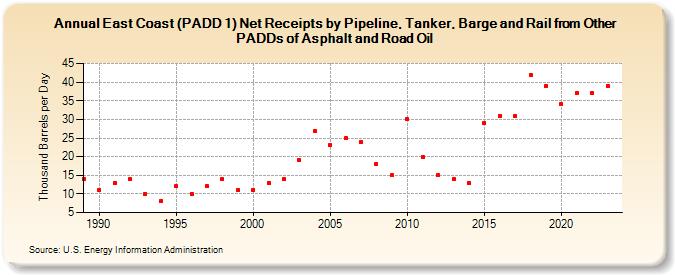
| East Coast (PADD 1) Net Receipts by Pipeline, Tanker, and Barge from Other PADDs of Asphalt and Road Oil (Thousand Barrels per Day) | ||||||||
| Decade | Year-0 | Year-1 | Year-2 | Year-3 | Year-4 | Year-5 | Year-6 | Year-7 | Year-8 | Year-9 |
|---|---|---|---|---|---|---|---|---|---|---|
| 1980's | 14 | |||||||||
| 1990's | 11 | 13 | 14 | 10 | 8 | 12 | 10 | 12 | 14 | 11 |
| 2000's | 11 | 13 | 14 | 19 | 27 | 23 | 25 | 24 | 18 | 15 |
| 2010's | 30 | 20 | 15 | 14 | 13 | 29 | 31 | 31 | 42 | 39 |
| 2020's | 34 | 37 | 37 | 39 |
| - = No Data Reported; -- = Not Applicable; NA = Not Available; W = Withheld to avoid disclosure of individual company data. |
| Release Date: 3/29/2024 |
| Next Release Date: 8/30/2024 |