|
Download Data (XLS File) |
|
||||||||
|
||||||||
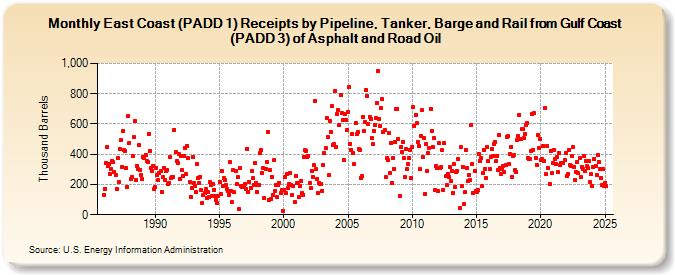
| East Coast (PADD 1) Receipts by Pipeline, Tanker, and Barge from Gulf Coast (PADD 3) of Asphalt and Road Oil (Thousand Barrels) | ||||||||
| Year | Jan | Feb | Mar | Apr | May | Jun | Jul | Aug | Sep | Oct | Nov | Dec |
|---|---|---|---|---|---|---|---|---|---|---|---|---|
| 1986 | 133 | 173 | 339 | 447 | 323 | 333 | 271 | 301 | 355 | 348 | 282 | 260 |
| 1987 | 173 | 377 | 218 | 434 | 492 | 318 | 553 | 425 | 424 | 306 | 180 | 652 |
| 1988 | 474 | 237 | 250 | 388 | 515 | 617 | 231 | 324 | 304 | 458 | 297 | 263 |
| 1989 | 235 | 383 | 374 | 397 | 356 | 347 | 533 | 421 | 307 | 292 | 324 | 172 |
| 1990 | 184 | 311 | 264 | 230 | 273 | 289 | 153 | 249 | 310 | 228 | 288 | 294 |
| 1991 | 200 | 213 | 379 | 241 | 252 | 251 | 562 | 413 | 353 | 345 | 399 | 237 |
| 1992 | 387 | 293 | 255 | 385 | 443 | 267 | 457 | 372 | 215 | 118 | 176 | 383 |
| 1993 | 213 | 192 | 149 | 334 | 241 | 208 | 252 | 161 | 75 | 129 | 141 | 168 |
| 1994 | 110 | 148 | 119 | 215 | 196 | 125 | 203 | 166 | 124 | 99 | 75 | 123 |
| 1995 | 215 | 139 | 290 | 188 | 243 | 228 | 198 | 170 | 159 | 131 | 346 | 154 |
| 1996 | 83 | 294 | 148 | 292 | 200 | 251 | 38 | 307 | 188 | 186 | 187 | 191 |
| 1997 | 201 | 171 | 437 | 151 | 218 | 176 | 291 | 240 | 196 | 342 | 212 | 153 |
| 1998 | 194 | 195 | 405 | 429 | 278 | 306 | 112 | 304 | 350 | 550 | 98 | 295 |
| 1999 | 105 | 248 | 129 | 363 | 159 | 195 | 114 | 194 | 212 | 143 | 163 | 27 |
| 2000 | 162 | 247 | 143 | 269 | 174 | 202 | 279 | 195 | 131 | 189 | 84 | 258 |
| 2001 | 207 | 209 | 118 | 187 | 225 | 141 | 133 | 380 | 425 | 424 | 384 | 387 |
| 2002 | 211 | 176 | 291 | 251 | 326 | 754 | 299 | 238 | 141 | 208 | 203 | 203 |
| 2003 | 159 | 328 | 407 | 442 | 642 | 515 | 260 | 621 | 548 | 716 | 463 | 468 |
| 2004 | 819 | 447 | 663 | 693 | 594 | 793 | 670 | 628 | 365 | 665 | 629 | 563 |
| 2005 | 680 | 843 | 469 | 426 | 537 | 407 | 338 | 604 | 531 | 549 | 432 | 429 |
| 2006 | 243 | 254 | 649 | 555 | 612 | 825 | 783 | 603 | 648 | 633 | 509 | 467 |
| 2007 | 556 | 595 | 638 | 739 | 950 | 635 | 587 | 707 | 762 | 544 | 559 | 249 |
| 2008 | 372 | 365 | 541 | 275 | 473 | 211 | 374 | 305 | 482 | 699 | 702 | 498 |
| 2009 | 126 | 445 | 413 | 484 | 373 | 251 | 432 | 300 | 334 | 372 | 428 | 242 |
| 2010 | 450 | 709 | 588 | 662 | 604 | 483 | 456 | 303 | 522 | 690 | 382 | 507 |
| 2011 | 140 | 469 | 290 | 407 | 442 | 702 | 556 | 449 | 508 | 161 | 321 | 306 |
| 2012 | 155 | 472 | 306 | 317 | 427 | 164 | 472 | 254 | 194 | 272 | 252 | 313 |
| 2013 | 224 | 288 | 144 | 334 | 186 | 282 | 288 | 368 | 45 | 445 | 191 | 316 |
| 2014 | 68 | 147 | 427 | 311 | 222 | 265 | 231 | 593 | 338 | 146 | 288 | 160 |
| 2015 | 151 | 161 | 404 | 356 | 373 | 187 | 277 | 428 | 304 | 241 | 451 | 355 |
| 2016 | 301 | 383 | 435 | 385 | 465 | 482 | 354 | 387 | 294 | 530 | 310 | 267 |
| 2017 | 301 | 324 | 283 | 328 | 516 | 522 | 333 | 404 | 451 | 252 | 390 | 394 |
| 2018 | 295 | 285 | 493 | 522 | 657 | 500 | 564 | 567 | 507 | 531 | 595 | 604 |
| 2019 | 373 | 367 | 367 | 419 | 663 | 429 | 670 | 377 | 332 | 524 | 443 | 502 |
| 2020 | 363 | 368 | 453 | 355 | 705 | 266 | 455 | 310 | 204 | 421 | 274 | 345 |
| 2021 | 430 | 366 | 334 | 384 | 282 | 410 | 326 | 340 | 340 | 339 | 361 | 411 |
| 2022 | 253 | 266 | 428 | 329 | 325 | 391 | 449 | 317 | 232 | 280 | 350 | 273 |
| 2023 | 373 | 248 | 317 | 305 | 388 | 288 | 358 | 319 | 308 | 354 | 214 | 267 |
| 2024 | 194 | |||||||||||
| - = No Data Reported; -- = Not Applicable; NA = Not Available; W = Withheld to avoid disclosure of individual company data. |
| Release Date: 3/29/2024 |
| Next Release Date: 4/30/2024 |