|
Download Data (XLS File) |
|
||||||||
|
||||||||
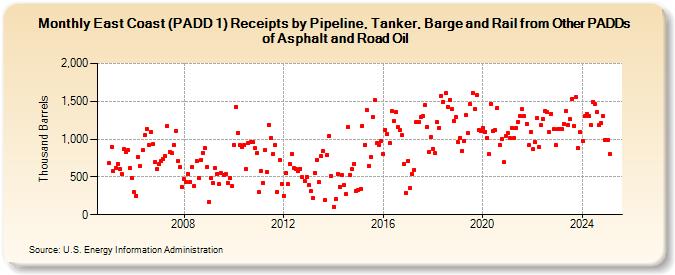
| East Coast (PADD 1) Receipts by Pipeline, Tanker, Barge and Rail from Other PADDs of Asphalt and Road Oil (Thousand Barrels) | ||||||||
| Year | Jan | Feb | Mar | Apr | May | Jun | Jul | Aug | Sep | Oct | Nov | Dec |
|---|---|---|---|---|---|---|---|---|---|---|---|---|
| 2005 | 680 | 896 | 575 | 621 | 675 | 611 | 539 | 867 | 835 | 852 | 620 | 483 |
| 2006 | 295 | 254 | 761 | 640 | 852 | 1,050 | 1,134 | 927 | 1,092 | 930 | 694 | 599 |
| 2007 | 668 | 710 | 743 | 774 | 1,178 | 832 | 822 | 928 | 1,113 | 713 | 625 | 367 |
| 2008 | 469 | 429 | 541 | 439 | 626 | 378 | 710 | 491 | 728 | 822 | 884 | 631 |
| 2009 | 171 | 489 | 413 | 617 | 542 | 404 | 546 | 528 | 533 | 422 | 488 | 382 |
| 2010 | 928 | 1,426 | 1,086 | 921 | 899 | 924 | 598 | 947 | 960 | 956 | 881 | 811 |
| 2011 | 298 | 581 | 422 | 859 | 563 | 1,193 | 1,016 | 806 | 922 | 305 | 721 | 412 |
| 2012 | 251 | 546 | 400 | 677 | 802 | 620 | 603 | 584 | 610 | 493 | 450 | 500 |
| 2013 | 388 | 308 | 223 | 556 | 730 | 427 | 771 | 836 | 196 | 787 | 1,046 | 514 |
| 2014 | 107 | 205 | 540 | 372 | 524 | 392 | 273 | 1,160 | 522 | 599 | 675 | 316 |
| 2015 | 328 | 345 | 1,177 | 922 | 1,390 | 649 | 766 | 1,287 | 1,513 | 944 | 925 | 977 |
| 2016 | 801 | 1,124 | 1,063 | 954 | 1,368 | 1,238 | 1,354 | 1,155 | 1,115 | 1,048 | 667 | 288 |
| 2017 | 714 | 354 | 540 | 596 | 1,221 | 1,227 | 1,286 | 1,299 | 1,445 | 1,165 | 829 | 1,025 |
| 2018 | 875 | 810 | 1,223 | 1,151 | 1,575 | 1,492 | 1,605 | 1,426 | 1,520 | 1,392 | 1,233 | 1,288 |
| 2019 | 961 | 1,017 | 844 | 979 | 1,313 | 1,077 | 1,461 | 1,610 | 1,396 | 1,580 | 1,119 | 1,112 |
| 2020 | 1,153 | 1,099 | 1,018 | 797 | 1,468 | 1,105 | 1,118 | 1,416 | 927 | 995 | 692 | 1,043 |
| 2021 | 1,075 | 1,009 | 1,149 | 1,018 | 1,147 | 1,229 | 1,305 | 1,394 | 1,300 | 1,206 | 916 | 1,097 |
| 2022 | 863 | 957 | 1,281 | 898 | 1,183 | 1,261 | 1,373 | 1,352 | 1,090 | 1,338 | 1,128 | 922 |
| 2023 | 1,127 | 1,140 | 1,129 | 1,203 | 1,369 | 1,189 | 1,262 | 1,534 | 1,171 | 1,553 | 880 | 1,097 |
| 2024 | 977 | 1,301 | 1,337 | 1,336 | 1,205 | 1,435 | ||||||
| - = No Data Reported; -- = Not Applicable; NA = Not Available; W = Withheld to avoid disclosure of individual company data. |
| Release Date: 8/30/2024 |
| Next Release Date: 9/30/2024 |